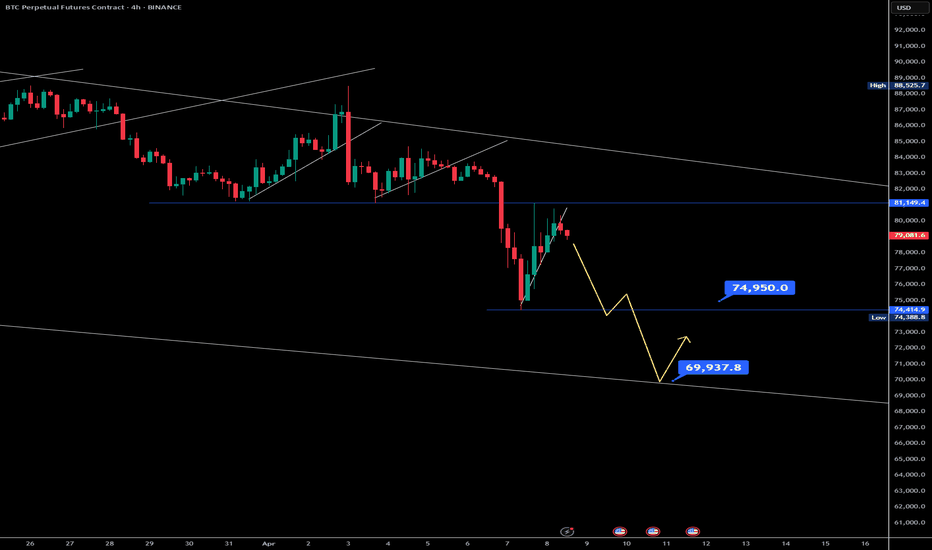
Bitcoin has recently formed a double top pattern near its all-time high at $112K–$110K, signaling potential exhaustion in the bullish momentum. After a strong rejection from the $106K resistance — a critical zone that has historically failed to close above on the daily timeframe — BTC is showing increasing bearish pressure. All major indicators — RSI, MACD, and...
Ethereum has officially broken above its previous resistance at $2900 and is now aiming for the critical $3000 psychological level. Here's a step-by-step breakdown of what to expect next, including MACD, RSI signals, and CPI data impact. 🔹 Step 1: Breakout Confirmation Ethereum has successfully broken above the $2900 resistance level — this area is now acting as...
#BTC/USD is showing signs of another lower high after facing strong rejection near the $110,000 resistance zone. The price is currently testing the $106,000 support area, a level that may serve as a crucial retest zone. If buyers step in here, we could see a bullish rebound and potential push toward a new high. However, if $106K fails to hold, the next support...
Bitcoin Bearish Flat Pattern Forming? Potential Short Setup to $97K-$98K if Rejected at $106K 📉 BTC recently hit a new all-time high around $112K, followed by a series of higher lows near $110K, $108K, and potentially $106K. If price gets rejected at $106K, a bearish flat pattern may play out—triggering a high-probability short opportunity toward the $97K–$98K...
Bitcoin has formed a clear bearish divergence on the daily timeframe, accompanied by declining volume, an inverted hammer candlestick at resistance, and a MACD crossover to the downside. Price has also retested the upper trendline but failed to break higher. Key levels to watch: First support: $96,000 If broken, further downside to $80,000 Ultimate support...
Bitcoin Double Top Formation Alert! Currently, CRYPTOCAP:BTC appears to be forming a Double Top pattern on the 4H chart. If this candle closes as an Inverted Hammer, it may confirm a bearish reversal from the overbought zone. Key Levels to Watch: Immediate Support: $96,500 – $95,000 Critical Support: $94,000 Major Breakdown Levels: If $94K breaks, next...
Bitcoin is showing strength towards the $88,000 mark, but the RSI on the 1-hour and 4-hour timeframes is significantly overbought, signaling the need for a healthy retracement. I’m expecting CRYPTOCAP:BTC pullback to the RSI 50 midline, which could align with a price retrace to around $85,000–$83,000. If BTC loses the $85K level, FWB:83K comes next. A deeper...
CRYPTOCAP:BTC previously formed a strong double bottom around the $74,500 level, which led to a bullish rally pushing the price up to a saturation zone near $86,000. However, current price action suggests a double top formation — a classic bearish reversal pattern. This aligns with RSI trendline rejection and signs of bearish divergence, reinforcing the bearish...
CRYPTOCAP:BTC is showing signs of exhaustion near the $83,500–$84,000 zone, with repeated rejections indicating weakening bullish momentum. Volume is steadily declining, which typically signals a lack of conviction from buyers. We may be witnessing the formation of a potential double top – a bearish reversal pattern. If confirmed, this could trigger a correction...
Bitcoin recently faced strong rejection near the $81,000 level, forming a potential double top pattern on the higher timeframes. This classic bearish reversal setup is now playing out, as price action has begun to decline from the second peak. Adding to the bearish confluence, the MACD has confirmed a bearish crossover, signaling weakening momentum and a...
🚨 Bitcoin Alert: CRYPTOCAP:BTC back above $87,000! 🚀 Key zone ahead: FWB:88K –$90K This level is make-or-break. Here’s what to watch: ✅ A strong breakout above $90K could spark the next leg up 🩸 Bearish divergence will also form which is dangerous that can trigger correction. ❌ Rejection at this zone might trigger a correction $79k #BTC #Bitcoin #Crypto
On the daily timeframe, USDT dominance is showing a bearish divergence: Price Action: Higher highs RSI: Lower highs This indicates potential weakness in USDT dominance. However, we need today’s candle close for confirmation. If confirmed, we could see a drop in USDT dominance from 4.5% to 3.8%, which may trigger a strong recovery in the crypto market. Traders...
📉 USDT Dominance Update 📉 USDT.D is showing bearish divergence – price rising while RSI declines. A drop from 5.42 to 4.38 is likely, giving BTC and alts a temporary relief. However, higher timeframes still look weak, so this move may not last long. Stay cautious! ⚠️
CRYPTOCAP:BTC Trading Idea – Short-Term Bounce Pattern: #BTC is forming a double bottom, indicating a potential trend reversal. RSI Divergence: Clear bullish divergence on RSI confirms buying momentum. Target Levels: First target: $89,000 Second target: $91,000 Third target: $93,500 Outlook: Expecting a short-term bounce before a potential correction....
DXY Shows Bearish Divergence and Breakdown – Bullish Implications for Bitcoin, Gold, and Forex The U.S. Dollar Index ( TVC:DXY ) has formed a clear bearish divergence on the weekly timeframe, indicating potential downside momentum. Additionally, it has lost key trendline support, further confirming weakness in the dollar. Key Support Levels for #DXY Next Major...
The asset has formed a total of three waves on the weekly timeframe and recently made a retest at the 740B level. It is likely to form a double bottom pattern here, with the RSI trendline indicating a clear bullish divergence. This suggests a potential bounce from this point, and based on these indicators, the next move is expected to propel the price to the 1.5...
Bitcoin has swept the lower-end liquidity and the market has since cooled. Now, BTC is likely to bounce off the $100,000 support level, which was previously a resistance. Alternatively, it may form a small double bottom here before bouncing towards the $110,000 range, with the next target around the $111,500 area.
$ETH/BTC has formed a clear bullish structure, with consistent higher lows and distinct bullish divergences. Now, we're awaiting a breakout, and once it occurs, we expect significant returns with ETH.


