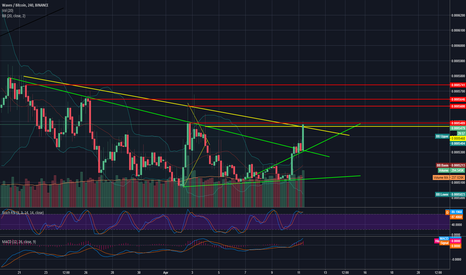
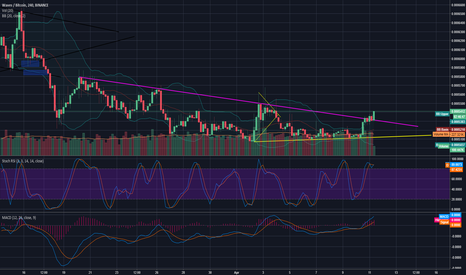
1h chart still needs a RSI reset, and we should see pump if bullish $BTC tendency continues
previously marked bull flag did not last even 3 days... let's see how long this will take to break. Don't take this as any real indicator, i am just curious and I am sharing this educational only
Stoch RSI is at seriously undersold, but there was period in previous frame that it remained like that for quite a while. I believe history will repeat is self and $VEN will retrace back to they buy zone, which is clearly marked on the chart.
Both FIB angle split (2/1) and FIB retrace (0.236) meet at roughly the possible buy/bounce zone - area between yellow lines.
There are 3 major resistance levels to cross, so this might be a bit choppy, but once it breaks out, we should see nice moves. While technically this looks sounds, $BTC drop can compromise this...
OBV and RSI look good on this one, so it should happen sooner than later, providing $BTC does not go bear.
OBV makes a bullish divergence. Tron just tried to break out of the wedge, but it has failed. Stoch RSI is undersold, so there seems to be lot of chance for making bullish breakout
dont do this at home
Some resistance and support levels marked.
Neo should go to 51 area before we can buy it
on 4h chart, we still have nearly 3h to close the candle, but so far it looks like a breakout
My first look at NEM, looks like it has +10 USD potential
let's see if it manages to break the line, if it happens, the history should repeat itself
about 2 days are left, till btc will run out space and it will have to make decision.
Tron followed fibs during the pump and current consolidation. During the last phase its more leaning towards the channels in green, but i think it will still fall into respective fibs when doing it movements. Stoch RSI is low, OBV is picking up. The next fib above 1.0 is quite high, so I am uncertain it will not make a 'half stop' on the way there, just to pump...
Upcoming tron network (31st March!) is putting a lot of pressure on tron. I see it breaking out from the current pennant in bullish way. Tron usually responds very badly to BTC drops, but during recent days it did the opposite, it actually tries to maintain it's USD value. It's not as bullish as it will be in 7 days from now, but it's getting there. Due to this +...
I've been following this bad boy for a while, it looks like it has a bullish breakout. I've put the nearest resistance levels (red line) and current support line (green). The white lines are the 'retired' resistance/support lines. Can come in handy when tron determines to plump down again.
Possible buy in zones for waves. When time comes, if price is around lower B.B and is at the buy in zones i've set, it's a must buy. I am still uncertain which buy zone it will be, so lower B.B. test is a good indicator


