cryptoonchain
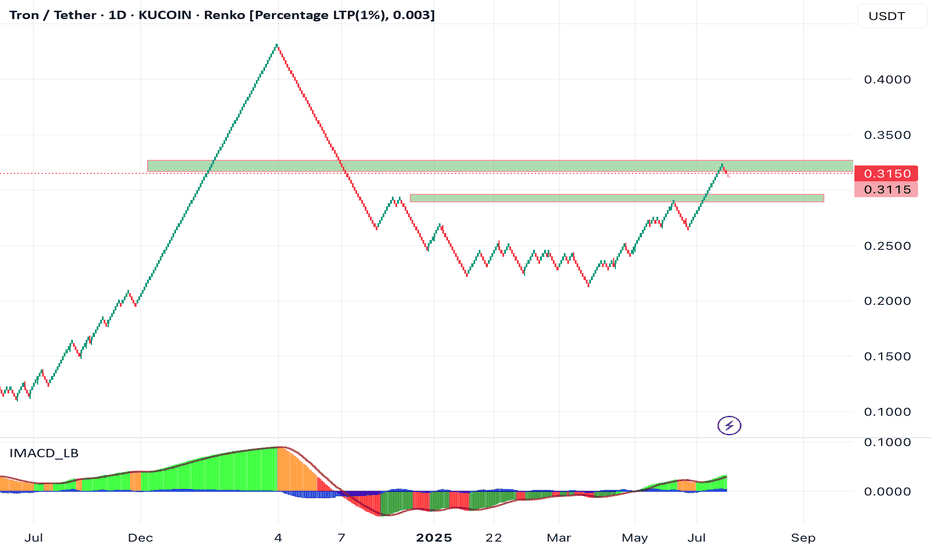
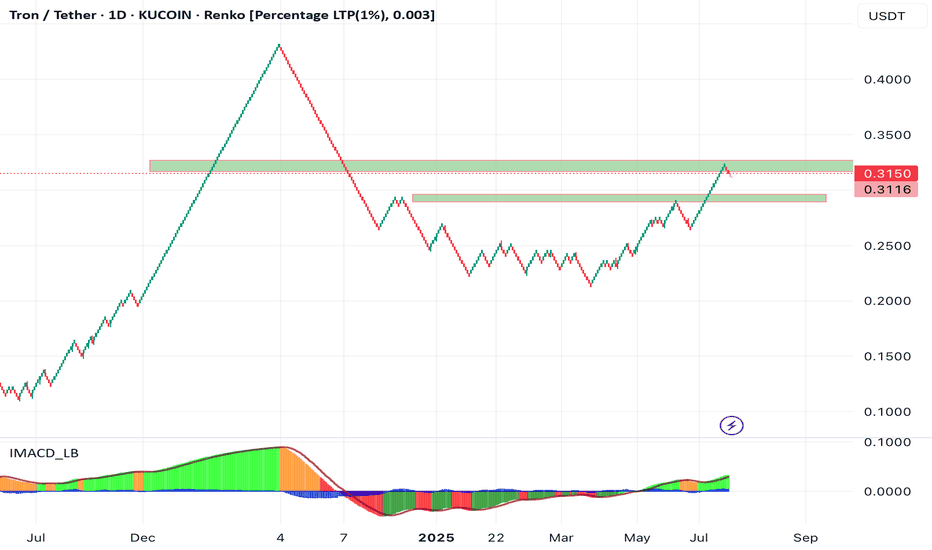
PremiumIn recent months, the TRON (TRX) network and price have witnessed remarkable stability and growth. According to a recent analysis by CryptoOnchain published on the CryptoQuant platform, one of the main indicators of this stability has been the unprecedented consistency in daily block production on the TRON network. The report highlights that the daily block count...
In recent months, the TRON (TRX) network and price have witnessed remarkable stability and growth. According to a recent analysis by CryptoOnchain published on the CryptoQuant platform, one of the main indicators of this stability has been the unprecedented consistency in daily block production on the TRON network. The report highlights that the daily block count...
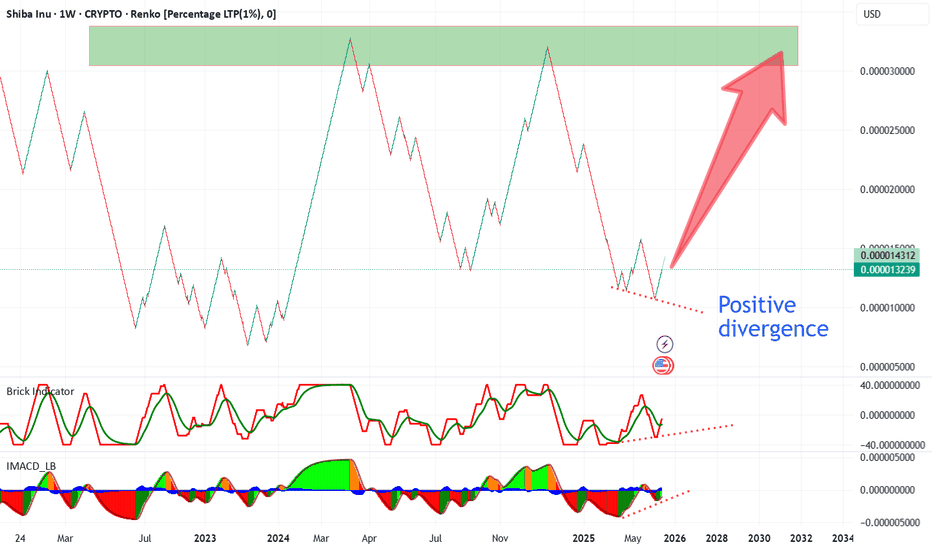
Positive divergence detected! On the weekly SHIBUSD chart (Renko, %), we see a clear positive divergence between price action and both the Brick Indicator and MACD. While the price printed new lows, momentum indicators are forming higher lows, suggesting fading bearish pressure and a possible reversal ahead. Key Resistance / Target: The main resistance zone is...
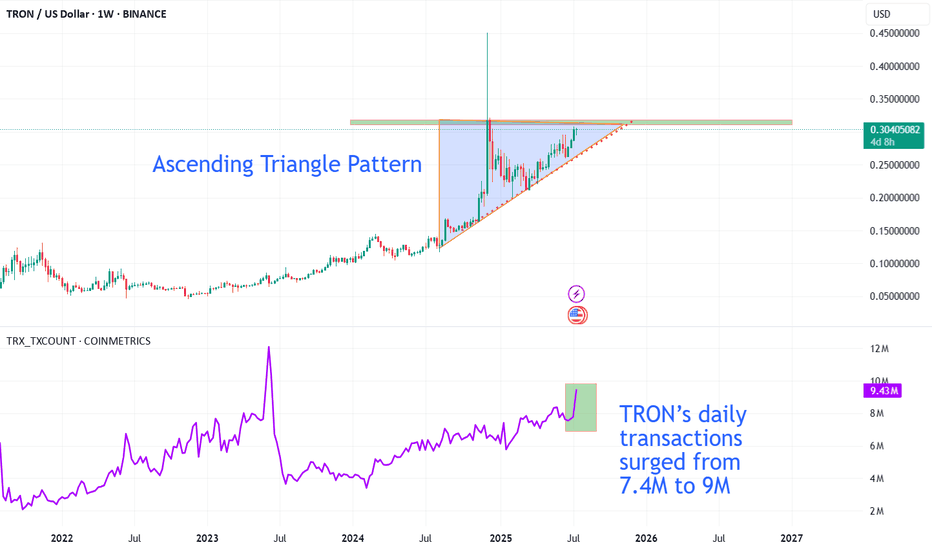
The TRX/USDT weekly chart is showing TRON testing a major resistance zone near $0.32, while forming a classic ascending triangle pattern just below this level. This bullish structure typically signals increasing momentum from buyers and raises the potential for a breakout above resistance. What makes the bullish case even more compelling is the strong on-chain...
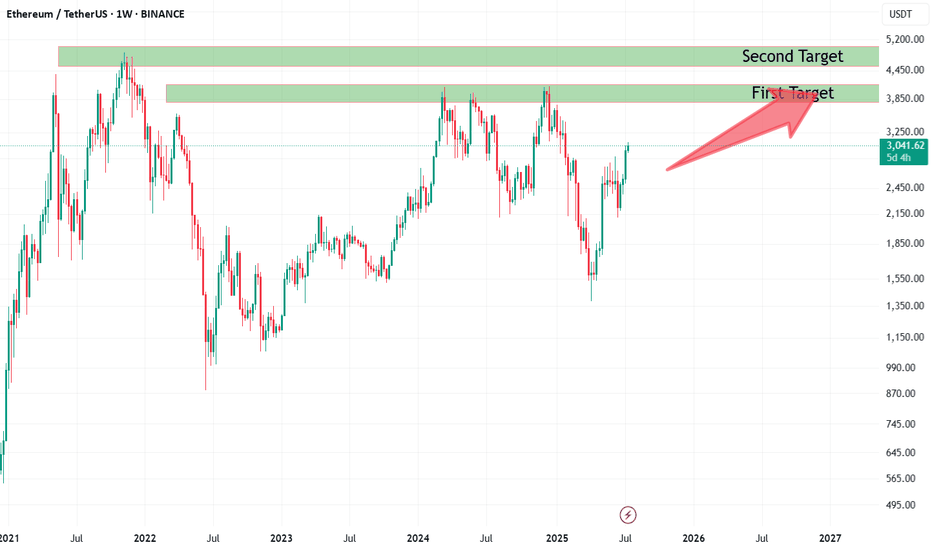
According to cryptoonchain’s analysis of on-chain data from CryptoQuant, Binance now holds about 25% of the total Ethereum reserves across all exchanges. This significant figure could be a sign of smart accumulation by major market participants. Notably, Binance’s rising share has occurred while overall ETH reserves on exchanges have remained stable. In a...
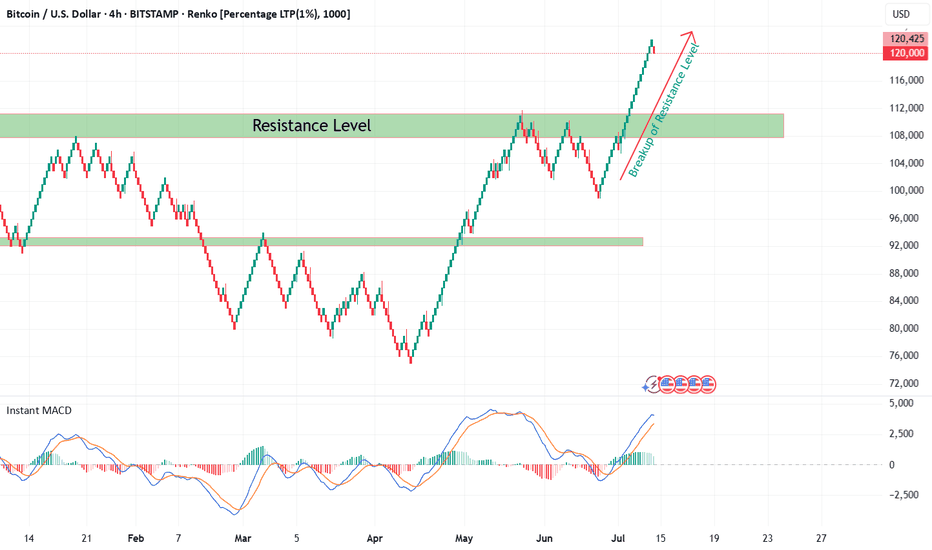
From late 2024 till now, Bitcoin (BTC/USD) was consolidating within a broad sideways range between well-defined support and resistance levels on the 4H Renko chart. During this time, market indecision was obvious as neither bulls nor bears could establish dominance. Recently, BTC has decisively broken out above the major resistance zone at ~$108,000 — as seen...
A week before the halving, Bitcoin is Forming an Ascending Triangle Pattern!
Ethereum broke up an important resistance level. Ethereum has respected this resistance level several times before. This is a long signal. The IMACD oscillator also shows that Ethereum is in an upward bias.
Bitcoin is on the uptrend. It is currently above the kumo Cloud and macd is bullish. It seems that the uptrend of Bitcoin will continue in the future.
just now Bitcoin is forming a large wedge pattern. This pattern is usually associated with a breakdown. The IMACD oscillator also indicates a bearish divergence
Bitcoin is above the support line of the Head and Shoulders pattern. The breakdown of this support level will cause the price to fall. Will BTC Break Down the Head and Shoulders Pattern?
The technical chart shows the market squeeze. On the price chart, Bitcoin seems to be forming a descending triangle pattern, which is usually followed by a breakdown. According to the on-chain data, the inflow to exchanges is increasing more than the outflow from them. These can indicate the possibility of a breakdown of the pattern in the future. For...
Bitcoin is forming a pennant pattern. It seems to be a bearish pennant, but it cannot be confirmed until the full breakout. For the transaction, it is better to wait for the Bitcoin breakout
On the Renko chart, BTC is below EMA 100 resistance level. In addition, Bitcoin is below the $30,000 resistance level. Bitcoin still has a bearish bias on the MACD Oscillator. To change this, Bitcoin must be able to break it up
BTC broke down the head and shoulders pattern. This is a bearish pattern and we should expect further price declines in the coming days
Bitcoin is below the resistance of the long-term descending channel in the weekly time frame. If it cannot cross this barrier, we will face a price reduction
Bitcoin is at the trendline support level and may be supported by it. Its breakdown can mean a new downtrend.
Bitcoin has a bullish flag pattern on the 4-hour time frame. Usually, this pattern is associated with a breakup. To confirm it, one should wait for the breakout of the support and resistance levels
