FX:USDZAR Based on the monthly pivots, it looks like USDZAR is to test 19.30 again. R1 = 19.3099. It rejected the pivot (18.5553) twice already.
HKEX:700 A triangle has formed for Tencent pointing at around $336. This will be an important price to monitor to determine a Long/Short trade. Also, take into account two gaps. Should the trend direction confirms an uptrend, those two gaps provide a good indication of potential profit.
China Tower ( HKEX:788 ) is about to test previous low at $1.65. It has rejected resistance $1.93 twice. More conservative target would be $1.70.
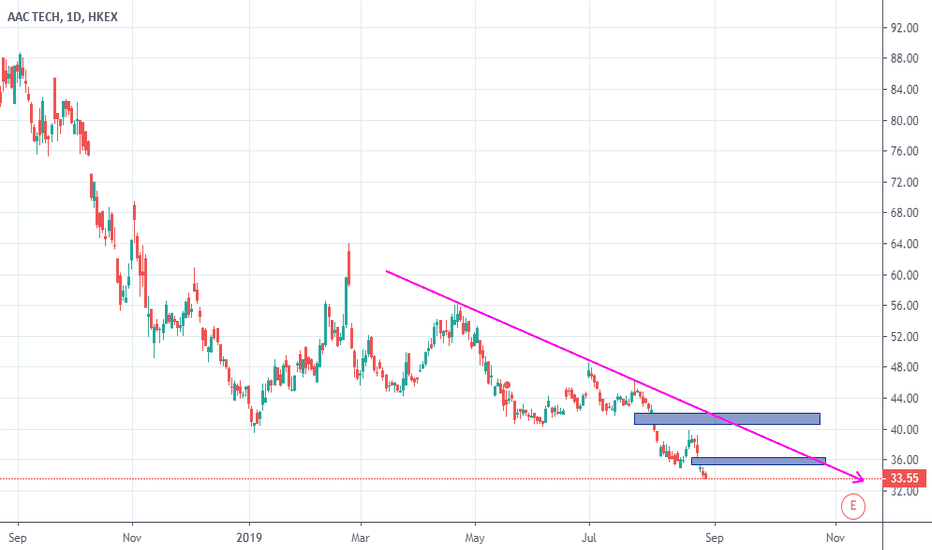
AAC Tech ( HKEX:2018 ) is still seeking its bottom. Trend: down. There were two gaps. Caution: First gap down: 01-02 August 2019 (Price: $42.00 - $40.50) Second gap down: 23-26 August 2019 (Price: $36.30 - $35.25)
HKEX:1038 CKI Holdings has recently broken the downtrend, with a support at $56.60. Gap up on 07 September 2018 with a price at $58.85. The resistance levels are as follows: R1: $61.50 R2: $67.20 R3: $69.60
CSOP A50 ETF is still under pressure, as it has not breakout the downtrend yet. Unless it is able to break out of the downtrend, there is a high possibility the downtrend will continue for the near future. This is also suggested by SAR as it is approaching its turning point. Resistance at $12.44. HKEX:2822
FX:USDZAR 15 minutes chart. Enter @14.4007. Target: 14.4637 Potential profits of 630 pips.
J200 Long South African Top40 Index. The analysis was done on a 4hour chart. Using Pivot Points as Targets. First Target: 51200 Second Target: 52000 Look out for retrace in the region between 51900 - 53000.
HKEX:2202 China Vanke has been in a downtrend since January 2018, peaked at $42.40 on 16 January 2018. Recent gapped up 13 September 2018, with current support at $25.00. Looking at the triangle, the point coincides with the support at $25.00 which then becomes our decision point for Long or Short. Assuming it is moving up, using Fibonacci 23.6% gets us to...


