dchua1969
One way to take continuous profits from your indices like SPX500, CN50, SHCOMP, HSI, etc is to buy or sell at different price level. In this case, a drop of 0.9% drop on the SPX500 last night is an year end SALE for me to grab. That way, you can average up or average down depending on whether you are buying or selling. Hope this is helpful.
You would see from the link we have a fantastic sell down for NGAS from 2.8 to a low of 2.275. By drawing the bearish trend line, you would see that the price has broken out of it at around 2.368 which present a great buying opportunity. Did you take it ? I hope you did. Price meets some resistance at 2.505 and is now faced with two options : 1.Break the...
It is premature to put a buy entry now as the price action has yet to break out from the bearish trend line. To anticipate a move to our liking is akin to asking the market to follow our direction, a grave mistake that I made and paid a price to learn this valuable lesson. WAIT, let the price action tells you what to do. Put this in your watch list and monitor....
With less than a month to go before the end of 2019, I am of the opinion that US will continue to rally towards the Christmas and ends 2019 with good results! Look at S&P 500 , Dow, Nadsdaq , Japan and many equities market hitting all time high. US Dollar will continue to go high as per the green arrows and if it does towards 2020, then we can expect EURUSD to...
Yen is considered as a safe haven and many a times , when there are uncertainty in the market, many will scramble to buy YEN, i.e. short USDJPY. Now, we are in a risk no environment thus benefitting the equities and bonds market. Thus, as seen on chart, USDJPY is more likely to proceed in an upward trajectory towards the gap at 110.9 to 111. Buy when price...
It is getting scarier to long DJI as it continues to go higher and higher. That of course is the perils of buying high and hoping it gets higher. In contrast with the VIX, it could breaks out from the red diagonal bearish trend line and edge higher or continue to head south towards the support level of 10.72. That would correspond an opposite direction for the...
If you had spent thousands on your Airpod, iPad, macbook, iPhone, etc , you have easily spent thousands of dollars on Apple products. Now till 2020, would you be excited if they are giving back what you had paid before back to you and much more ? All you have to do is to buy some shares of Apple. Don't expect to keep this a secret as the more people buy this...
Let's see if the price would continue to charge up towards 1.33 price level before breaking down. Note that if you sell now before the breakdown, you need to prepare a much wider SL to cushion and be patient enough to hold out longer. Be patient and wait. There is again no guarantee that price action MUST retreat from 1.33 (we are merely basing on historical...
Chart is showing a nice pennant pattern formed. It is more likely to breakout and shoot higher ! However, there is also a possibility that it retraces slightly more before going higher. Some may argue about the co-relation between equity and gold , i.e.. if one moves up, the other must moves down. That is not true as there are instances where both are moving up...
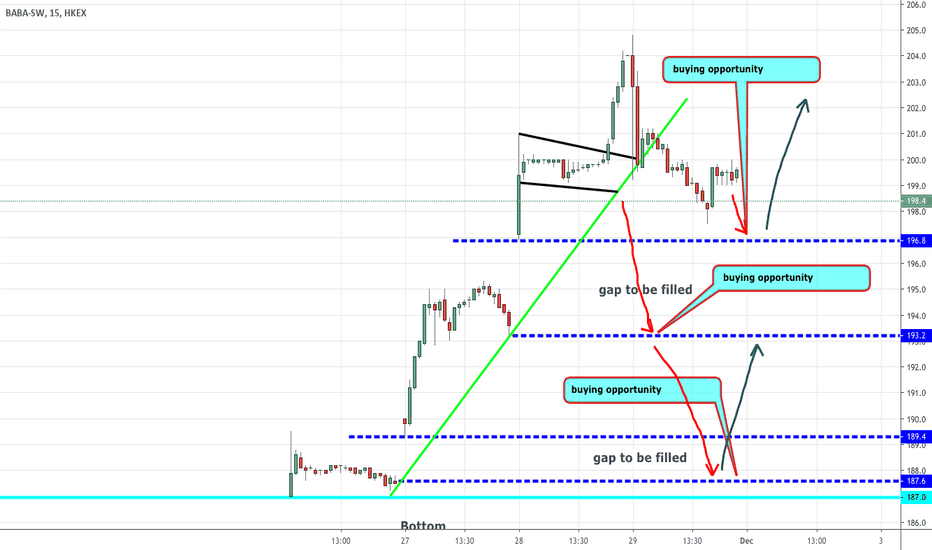
This is Alibaba that is recently listed in HK. I usually do not trade IPO as it lacks historical data to provide a good chart analysis but several followers wanted this, so this is the best I could do. This is a 15 min chart and you can see 2 big gap up during the new issue. The price has now broken down from the bullish trend line and 3 scenarios are likely...
Notice after the gaps been closed, the price action kept hovering around this price level, making it a strong support level. Last 2 red candles are highly bearish, pin bars and likely to falls back to the support level again. SELL
For me who stays in Singapore and buy things from Amazon from time to time, this currency exchange does not work in my favour. That means, I have to give up or sell more SGD currency to get/buy 1 US dollar. So before it goes even higher as I think it would from the chart, this Christmas might be a good time for me to go shopping again!
This chart is beautiful as it presents a great selling opportunity. Now the profit target (red dotted line) is also the 618 FIB level so if it reaches there ,expect some pullback as well. It could also retrace a little and continue to dive southwards to meet the gap to be closed. However, if the price action does reverse and pullback aggressively back into the...


