dchua1969
See the chart Trade safely Always use a strategy Have Fun
Look at my chart for BTCUSD, if it does pull back , then LTCBTC will continue to hit higher. The last green candle shows me selling may be over and bulls camp are taking over.If I am right, then it would bounce from the lower channel/flag and return to the peak point. Let's see if it plays out the way I want it.
Blue dotted line - support line Inverse Cup and Handle pattern - another smaller inverse cup and handle is forming in process, giving buyers a false sense of breakout before it pulls back again to hit below the support line. Also, notice the MACD is going to cross over, if it does, then short term, it would goes up. Let's see if it turns out the way as per my chart.
ABC pattern completed, a doji pattern appeared on top, signalling a reversal trend, likely to pull back before going up further. Buy on dip
What do you think? Please feel free to comment
Note, I used FIB Level as a guide, it may not reach exactly at the price zone, so monitor the price action on lower time frame
First, I look at the monthly chart, it shows me a bullish trend from day 1. Again, don't cry over spilt milk, why didn't I put $100 in it when it was $1.78 in 1969 , some 40 over years ago ( if you are in that era). Good if you are still holding, congrats! A multi-bagger. Next, I zoom into the weekly chart and I identify a nice ABC pattern with C partially...
I believe some profit taking is imminent in the coming weeks and a right handle is forming (ie. downwards) and then it would breakout of the cup base line (support) before breaking out to touch the 618 FIB level which is the 66.8 price zone. Please note that oil is a volatile stock so if strongly advise to have a bigger SL or reduce your position size if you are...
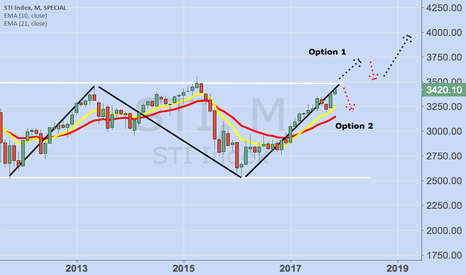
2 Options as we come to the crossroads soon. Option 1 : Breakout and pullback and head northwards to 4000+ price level Option 2 : Breakdown as per previous 2 attempts Analysts are expecting a breakout of 3500 , read news here www.todayonline.com I do not trade this index but use it as a barometer for overall stock performance and dive down into individual...
There were 3 nice support points at the 50% FIB Level. Wait for the breakout of this channel, retrace and buy. I expect it to take off soon
www.zerohedge.com It is news like this that make it so sensational and highly appealing for people to stop what they are doing and pour endless energy into cryptocurrency. Now who doesn't want to earn the bragging rights to say you earn higher than Mark?


