dhenys
based on my chart , ETH USDT will for sure go up tested resistance 1 and 2. so if you want to buy its not to late to buy now and hold it until resistance 1 for minimum Take Profit area. if there is correction i think its only minor correction no need to worried. Please be patience when you hold ETHUSDT for LONG position.
based on my chart, BTC USDT for sure will go up tested resistance area 1 and then had correction and go up again tested resistance 2 for sure we can had LONG position. Patience is the key
if you see BTC USDT based in daily chart it already going down into support 1 as we can see now, it also break down support 1 and continue to going to support 2 you can see it more clearly if you go to H1 timeframe if suggest you to short until support 2 and if you want to buy BTCUSDT please wait until support 2
you can see, ETH USDT will go down for sure into support level 2 In support level 1, when you lower the time frame in to H1 you can see the double top pattern that will lead ETH USDT into support level 2 II analize using fibonacci and support resistance area
Saham KBLI secara monthly time frame sedang memulai fase bullish. Diharapkan mampu naik menuju ke target primary movement di harga 830.
Saham DUCk akan melanjutkan koreksinya ke area 364- 396 sebelum melanjutkan trend kenaikannya
hope can achieve the 3rd target. if breakout impulsive in 1 and 2nd target then it will go to 3rd target for sure
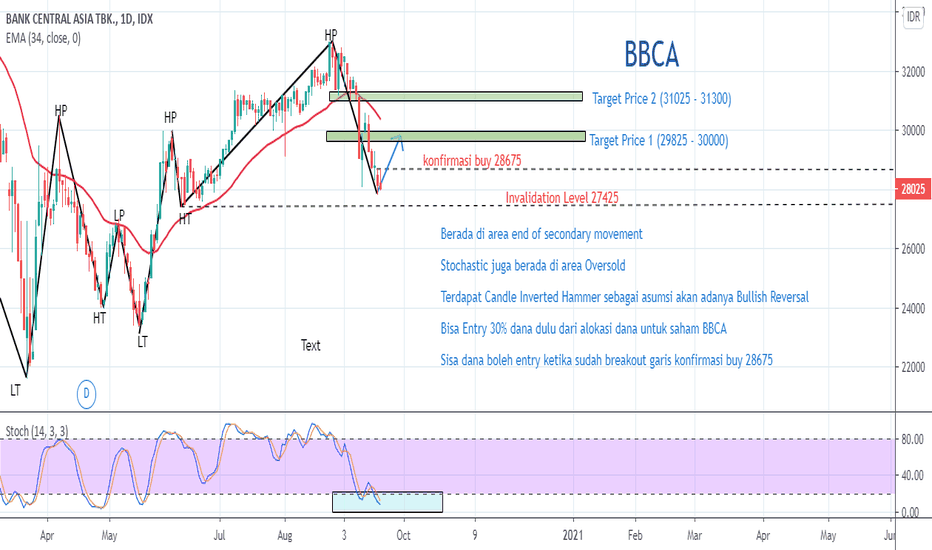
Hope can achieve the target price for BBCA


