discobiscuit
UltimateBearish count for US30. Impulse wave from ATH, wave ((2)) is expanded flat, wave ((4)) appears to be a double-three, with (W) a regular flat, (X) and (Y) are zigzags. I like wave (((4)) to finish below resistance at 42008, with wave ((5)) to approach October 2022 low of 28586.8.
Technical analysis for DXY. Looking for bottom about 89.209 to complete wave B of zigzag (Y). Would then look for wave C of (Y) to break above 121.020 resistance (bearish pitchfork never tagged median line).
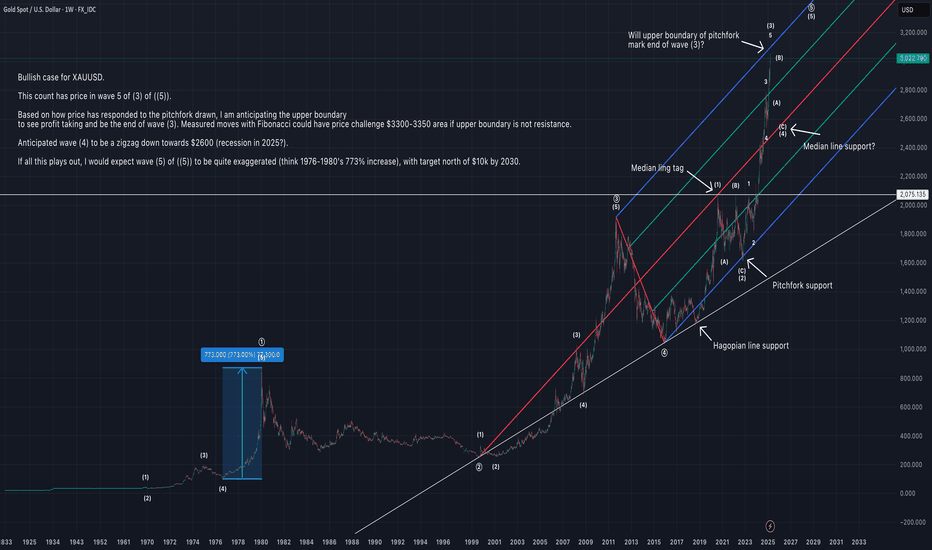
Bullish case for XAUUSD. This count has price in wave 5 of (3) of ((5)). Based on how price has responded to the pitchfork drawn, I am anticipating the upper boundary to see profit taking and be the end of wave (3). Measured moves with Fibonacci could have price challenge $3300-3350 area if upper boundary is not resistance. Anticipated wave (4) to be a zigzag...
Bearish case for equities. Chart comparing DJT and SPX. DJT in wave ((c)) of regular flat, SPX in wave ((c)) of expanded flat. SPX showing ending diagonal (wedge) to complete wave ((b)). Bottom of SPX pitchfork (blue line) broke support and now acting as resistance. This count anticipates each market to soon have a large (15-20%) 5-wave impulsive move down, DJT...
I don't normally apply Elliott Wave Theory to individual stocks, but MSFT is about as clean as it gets. Wave 2 is a zigzag of long duration, wave 4 is a triple-three of relatively short duration. RSI with bearish divergence. If this proves to be correct, the ultimate buy/long would be back towards the March 2020/COVID low (white rectangle).
ETHUSD technical analysis. Bears targeting median line (red line) of larger pitchfork by the end of August 2025. Median line of smaller, bullish pitchfork never tagged, Hagopian line acted as support at blue arrows, now breached and acting as resistance. Key levels/support at 1071.11 and 879.80, as well as parallel channel support.
Technical analysis of SPX. Bearish count/analysis presented, cleaned up to present important points. Parallel channels frame price action since March 2020 low nearly perfectly, with key pivots pointed out. With count presented, ((B)) is 200% of ((A)). End of ((B)) counted with impulse ending with ending diagonal wedge. Impulsive price action broke through...
Chart comparing SPX and DJT. SPX drawn with expanded flat, (b) is 200% of (a) and completes with ending diagonal wedge. DJT drawn with regular flat, (b) ~90% of (a), wave (c) began in November of 2024 and currently in wave iii of (c). Bears looking for SPX pitchfork support to break and become resistance, both SPX and DJT looking to eventually break October...
Proposed top with ending diagonal (5) of ((c)) of y of B, with anticipated impulsive price action towards October 2022 lows. For ((c)), (1) > (3) > (5), count valid below price of 6172.35.
Chart comparing SPX and DJT. This count has SPX and DJT in wave ((2)) of ((5)), with wave ((2)) of SPX as an expanded flat and wave ((2)) of DJT as a regular flat. For SPX, wave B of the expanded flat ends up being 200% of wave A (nearly to the tic). For DJT, wave B of the regular flat ends up being ~90% of wave A. If correct, would expect wave C to target...
Bearish analysis of US500/SPX. Weekly RSI with bearish divergence. Median line of pitchfork remains untagged, implying move down towards October 2022 low. Convergence of fib levels/resistance at 6123.9-6144.4; length of move from October 2022 low is the same length as move from March 2020 low to January 2022 high, ATH with near-perfect tag of 2 fib channel...
Technical analysis for US10Y. This count is looking for one more push up in yields, approaching (but not going above) 5.215%. Median line is target. This would complete an expanded flat that started in 2012. This analysis would suggest the end of the bond bear market is approaching, as long as 5.215% holds as resistance. Yields above 5.215% would suggest much...
Technical analysis for US30 (DJI). Two bearish counts, both have corrective expanded flat for wave ii or b. Price tagged .5 fib retracement from ATH to 5 August low, tagged median line target with reaction/profit taking seen last week. There could be more upside towards ATH to complete the ((c)), but with these bearish counts suggesting either a zigzag or...
Technical analysis of DXY. This is a bearish analysis which sees price in a wave (c) of ((B)), looking for sub-100 target at median line, above support at 89.209. Key resistance now at 110.176.
Technical analysis of ETHUSD. Bullish analysis, with price displayed in wave (1) of ((3)) of iii. Wave ((2)) of iii displayed as completed double-combo wave (W as expanded flat, X and Y as zigzags). Key support is 2913.75.
Technical analysis of US30/DJI. Two bearish counts presented, both of which have an expanded flat corrective structure starting on 20 December 2024. Wave 5 of (c) in progress. Fibonacci and measured move off low of 13 January 2025 included. ATH at 45105.1 is key resistance.
Technical analysis for US500/SPX. Another possible bearish count, with wedge containing a leading diagonal A or 1. If correct, wave 5 would stop short of 5684.1.
Technical analysis of US500/SPX. Three different counts, one bullish (green) and two bearish (yellow, red). Green count has primary double combo wave to complete the correction, bottom in at 5756.90. Yellow and red counts both have an expanded flat correction starting on 20 December and are projecting wave (c) to complete above 6039.6. Yellow count has the...


