dokterTrader
EssentialIf we look at the underlying market structure, Bitcoin's structure isn't fully formed yet. There are still unsolved puzzles around 135,000. I believe Bitcoin will finalize its final structure around 135,000, which will be its expansionary structure. The final candle on this weekly timeframe will determine Bitcoin's direction. This August, Bitcoin will either...
Elliott Wave is a technical analysis theory used to predict future asset price movements. This theory was developed by Ralph Nelson Elliott, an American accountant and author in the 1930s. This theory is based on the assumption that asset price movements are influenced by the psychological conditions of market players. Elliott Wave Types Impulse waves or...
ETH is making a path to grab the liquidity at the 2030 price. And I see a big opportunity here, from my TA results the price will move to close the imbalance in the 2144 - 2711 area. We can prove this TA with: 1. ETH has formed the ABCD Pattern and the value of BD = 1.891 which means the price will reverse, and it has proven that the price has reversed. 2....
Since April 5th, ETH has fallen significantly,,, which is -6.41%. I'm trying to analyze ETH price movements, and I see that the level of 1761.25 will determine whether the price will continue to bearish or will turn back to be bullish. 📚 Always follow your trading plan regarding entry, risk management, and trade management. Enjoy Your Trading! All Strategies...
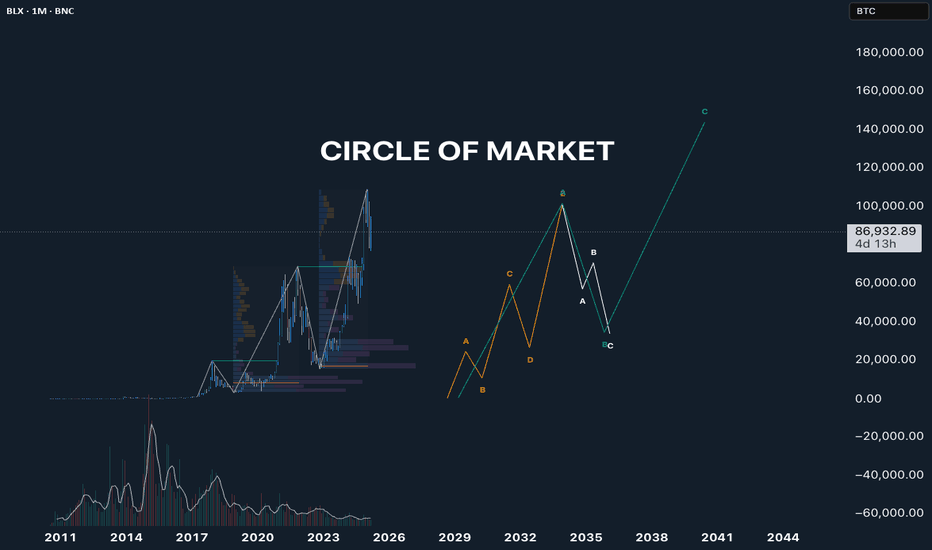
market movement not random. it was created. most of us as a retail unaware about that. and this is the circle of market. hope it can help you you can see the circle on High Time Frame
I see that ETH is in a correction phase. so I try to analyze the direction of the market. there are 2 possibilities for the price to move, possibility A the price will pull back from Orderblock 1H (OB 1H) and break mSWH then the price will go back down until finally it will move towards SWH possibility B the price will break OB 1H and towards OB...
try to learn ABCD pattern and you will found the invisible pathway
ETH make a perfect triangle at Daily timeframe and it is so beautiful pattern. Beautiful is so dangeraous. why? cause the present price can be go up ( line (A) ) or down ( line (B) ). But... the high probability for me is line B . I found the golden ratio at that level + FTR + S/R triangle.
I'm trying to identify major price action on a monthly timeframe. and there are major swing high and major swing low at the candle in this month. we need to make sure and know if this month is not over yet. so there is a possibility if the price can make new HIGH (C) toward to berish imbalance (-IMB). i assume if this month's candle will not cross the previous...
open 1W timeframe and we can see if the BTC make the formation like i draw. hope it can be useful for all us and let learn together and profit together
From this chart we can see the price is trying to rebalance the gap below. I assume that the price will move up lil bit... then down to the gap area
If the price moves up, it is possible that the price will rebalance the gap. And if the price breaks the line 1, it is possible that the price will continue to move high. But if the line 1 is rejected then moves down and breaks the line 2, then it is possible that the price will rebalance the gap below the SWL_1W
BTC has a correlation with others crypto market. and this is the TA that i made using 1W timeframe. dont thanks to me now. thanks to me after you made dollars from this scenario 😂👌🏻
I always try to analyze the market with big TF to determine the price direction. Then I will move to a small timeframe for execution and of course we also need liquidity.
I am trying to analyze the movement of BTC using a GAP closing scenario
If we look at the 1D timeframe chart there is a strong demand zone and this possibility will be one of the momentum for a reversal. And if this is true then the price will close the big gap at the price 1354.40 - 1544.94
after making LowerLow the candle making pullback and bullish trend. i use TF 5min to execute the entry point with Zero Lag EMA indicator


![Crypto wants to rebalance the GAP [4H TF] TOTAL: Crypto wants to rebalance the GAP [4H TF]](https://s3.tradingview.com/z/zcE0BZka_mid.png)


![After 1W TF --> I'm going to 15min TF [BTC] BTCUSDT: After 1W TF --> I'm going to 15min TF [BTC]](https://s3.tradingview.com/k/KCjwS77h_mid.png)


