The Bullish AB=CD pattern has completed and price is finding support at the "Fibonacci Support Cluster 2" on my chart. RSI is oversold and turning up. Also, we have hit the bottom trend line of the descending channel where we may have found support. In case you are wondering, I erased the "Fibonacci Support Cluster 1" because it is no longer relevant....
I have been waiting for this Gartley to complete for quite sometime and it finally has. The fibonacci levels on the AUDUSD pair are optimal and this is a beautiful Gartley! This, with RSI in overbought territories, gives us a nice case to take out a short position. Targets are shown on my chart. domavila
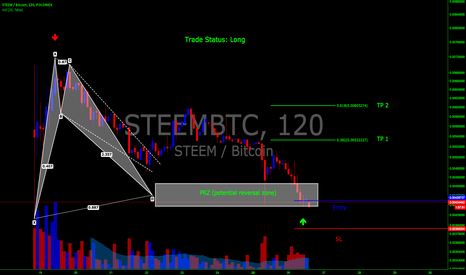
This is a continuation of my analysis on the STEEMBTC pair on the 120 minute timeframe. Please see below for previous analysis on this pair. After Looking at the STEEM/BTC pair I realized I was too premature in my entry last night and should have been more patient and waited for the Deep Crab to fully complete and for price to test all levels of the PRZ before...
The harmonic has completed and RSI is overbought. Also, price is running into fibonacci resistance where there is nice fib confluence. Time to go short.
After the harmonic pattern has completed at the 1.618 retracement and RSI oversold we are looking for a Type 1 reaction to target 1.
RSI is extremely oversold and the harmonic has almost completed.
It looks like we got in the previous trade too early and should have waited for price to test the 1.127 extension: please see my previous chart below. I am looking for a reversal here at around 1.272 fib extension. RSI looks oversold and could be turning up soon. I am watching price action here closely and will be looking for a trade entry if the opportunity arises.
After price retested the PRZ and support held I have re entered my long position. I am looking for a Type 2 reaction here. Looks like a nice triple bottom as formed too. Entry: 0.00332 Stop Loss: 0.00305 Target 1: 0.0049 Target 2: 0.0059
After price retested the PRZ and support held it looks like a Type 2 reaction.
After price retested the PRZ and price held, combined with the possible triple bottom, I have taken a long position on the ETC/BTC pair, 120 minute timeframe on the Poloniex exchange. I expect to see a Type 2 harmonic reaction here.
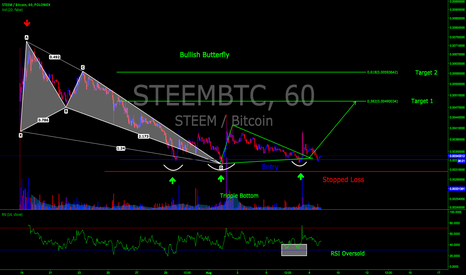
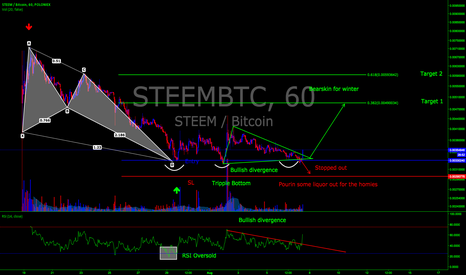
The harmonic pattern has completed and price has consolidated nicely in this range. It appears a triple bottom may have formed which is another case to go long. A triangle has formed and is coming to an end soon so there is bound to be some moves soon in either direction. All targets, entry, and and stop loss are shown on the chart.
The harmonic pattern has completed. A double bottom has formed and RSI is oversold and turning up. All targets are shown on my chart.
The harmonic pattern is complete and price action looks bullish in the PRZ. With RSI in the oversold area this is a buy signal to me.
RSI overbought and the harmonic completed right at resistance. Great risk to reward ratio on this one with a tight SL. Targets are the three fibs.


