dsorchestra90
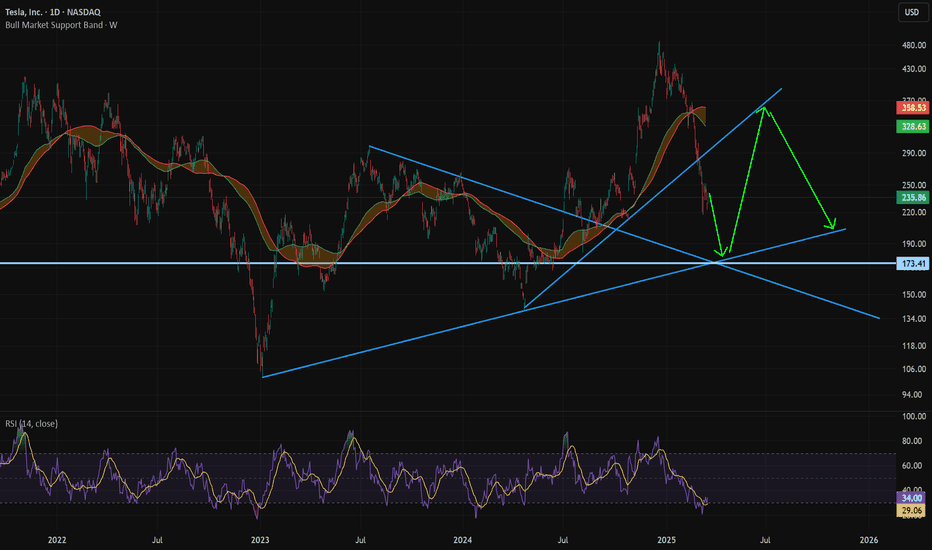
EssentialThis is probably really dumb, but I thought it looked cool, appreciate any feedback #longterm #trend
TSLA- Drop to ~180, Rally to 350, Broadening Wedge. RSI super low- think we get 1 more flush (perhaps April 4th labor data causes some market indigestion.
eth btc perhaps double bottom structure, then rally to the downward sloping trend-line for alt season/end of cycle.
WGO leads S&P it crashed way priorto spy follow the trend its your friend
New here so please help if i've missed something. i think we could see a short-term rally to 3,138 (bb level) or even 3,333 if things get really over extended and take out the 6/8 high. My base case however is brief rally monday/tuesday and sell into and through quad-witching. I also think the market will turn its attention to the election and potential for a...
Current Support: 69-70 Near-Term support: 63 I like Gilead for fundo reasons (massive FCF) but the market is correctly worried about declining hep c revenues and the lack of a transformative acquisition. The trend is clearly down with regards to price, MACD, and RSI. RSI trend-line needs to reverse in order for price to appreciate in my view.
I like GILD for fundamental reasons but the market is worried about declining hep c revenues and the chart is clear. could bottom here at 69-70, but if it goes below 69 I think we revisit 63 where there is pretty strong support. RSI is in a clear downtrend, which needs to be cleared before price and momentum can reverse positively
bearish chart- macd crossover coppock rolling negative rsi topped out 09 trend line broken
Has alread bounced on supper multiple times Appears read to bereak H&S pattern MACD trending negative Coppock Curve trending negative RSI trending negative
Great company, horrible stock, looks ready to dump more. Potential support at 63-64.
large differential with oil and all technicals look topped out
Possible H&S, top of left shoulder/neckling is in the low 90s, an area that has been hit a few times. The 2009 trend-line broke in 2015. MACD is positive and looks like it could have a postivie cross-over. CCI and RSI both trendling lower, but not low enough to warrant a bottom. Leaning bearish but signals are mixed.
Still think rates will head lower due for a myriad of reasons, but in the short term, it is plausible that rates will go higher for technical reasons. Longer-Term Reasons for lower rates (i.e. lower for longer)- 1) Monetary Policy remains accommodative 2) Growth/Inflation expectations remain subdued 3) Foreign buying interest from places with negative yields on...
I'd say closer to a short than a long, but we still need a clearer picture. A break 24.5/25 would be bullish, a break below 20 or so, bearish. THink we will move one way or the other in the coming months based on important fundos such as Spanish Election, Brexit, US election, China, etc.
Might be H&S forming, but also could break higher. Not really sure right now, but it looks like a big move could be underway. MACD looks a bit unclear, CCI appears to be bottoming, RSI looks like it could rebound but near 50. New phone looks to be a bust, and is just meant to be a filler pre-7 release.
RSI under 70 and drifting lower MACD trending negative, and appearing topped out LT Trend line from 09 broken 00 and 08 bubbles looked very similar in these 3 regards. on the fundamentals front- china devaluation, removal of qe & 0% rates from the fed, energy and commodities crash, etc.
Draghi jaw boning or further QE could put the immediate moves into question.. From just reading the char however, the euro seems to be staging a relief rally (MACD about to cross bullish, oversold yet recovering RSI, bottoming out Coppock curve. Over-head resistance sits ~1.25, where I think EUR will fail and reverse, break thru parity, and sink test the all time...
Near term catalyst- Bullish engulfing on 7/7 Bullish MACD crossing Broken distribution trend line RSI breaks out of over-sold conditions. In the intermediate term, CHK still appears to be moving in a range. Based on the upper line, it looks like 14 will be an important area. It it breaks through 14, there is a gap at ~18.50 that may be filled. If it meets...


