elite_trader_1-
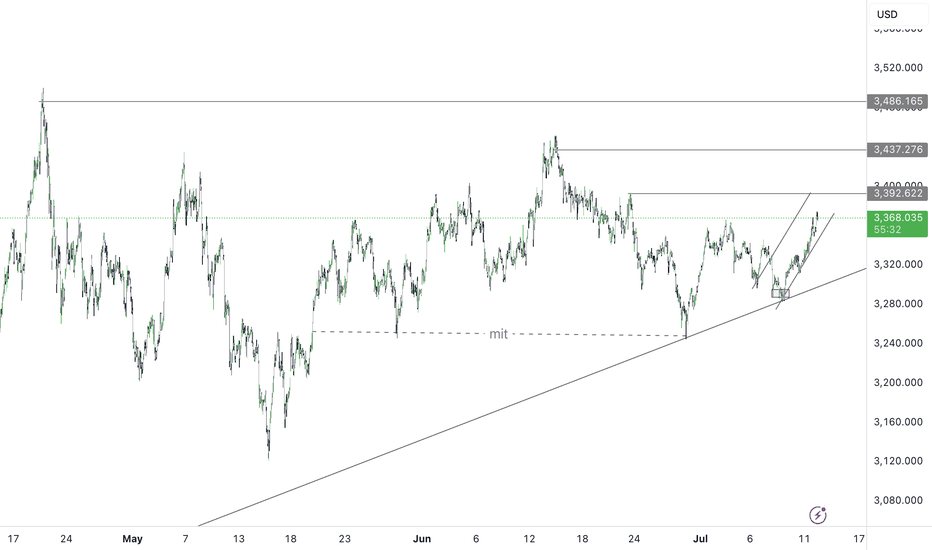
PremiumAfter the bearishretracement, the bears lost the momentum when the price couldn't break lower than 3230's . Bullish path leads us to 3390's and could break above 3400 Further market updates would be given as the market gains momentum
GOLD has been showing a bearish. sentiment as July candle hedges around its formation. Note that this bearish setup is merely a monthly retracement as gold is still bullish on the long term overview .The path of this bearish pullback leads to the 3200's as we're curreently at the 3310's and if we break past 3304 zone, we go for more lower liquidity. POI- 3304, 3280, 3260
We saw gold impose a strong bullish strength since the open of this new week, and even at the beginning of the new month (JULY). Based on this analysis, this bullish momentum has structured in a bullish trend channel which has been shown, we still have more top liquidity to mitigate as we have made a bearish retracement for a continued bullish rally to 3360's,...
After the bearish sentiment taking out the 3245 lows, we saw gold rally back up to the 3290's aiming for the 3300's which is a very important breakout zone. further bullish pump breaking the 3300 zone could result in more upside; (3316,3330) but a decline in the bullish momentum would result in more lower liquidity being taken out. Bearish sentiment leads to...
Gold has shown to be bearish following the lower liquidity sweep trend channel just as shown in the analysis. This trend channel shows a path down to the 3270's and 3260's. Further updates would be given as the market gains momentum.
📊 Gold Market Analysis – Bullish Outlook Developing In yesterday’s market, we observed gold take out a key lower liquidity in the 3370s range. This liquidity sweep typically indicates the clearing of weak hands and positions the market for a potential reversal or continuation of a larger trend. Following this move, gold has begun to establish a bullish trend...
Just as seen in the analysis, we see gold has filled its trend channel thereby giving the market a bearish stance creating bearish pull until the next POI WE have our eyes on 3383 as a substantial zone for pullback correction zone and if any change in market sentiment, it would be updated ....
Just as analysed, there was a strong bullish setup at the close of last week so this move was just taking out top liquidity, continuing its course of bullish rally. We can also spot a bullish trend build up from the 3400's which projected to the 3450's before making its retracement last week. we expect Gold to go for more higher liquidity as we are close to the...
We see a visible path to 3500 on the xauusd market. After the breakout at 3400 which extended to 3440's clearing a solid supply zone, gold then had a retracement and rallied back to 3420's which has a solid outlook on the 4hour time frame. Do not forget that today is friday so dont push the moves . .......Further breakdown on the lower timeframe
We've experienced gold surge in the last 3days (about 1000pips) This analysis was made on the Daily timeframe were we've observed a bullish trend and if we break past 3430, we have a lot of liquidity above and could float; But if it holds through, we expect a minor bearish pullbacks Further updates would be given, Stay Tuned
We've experienced gold surge in the last 3days (about 1000pips) This analysis was made on the Daily timeframe were we've observed a bullish trend and if we break past 3430, we have a lot of liquidity above and could float; But if it holds through, we expect a minor bullish pullbacks Further updates would be given, Stay Tuned
Current Range: $3,200 support / $3,250 resistance. Watch for: A breakout above $3,250 could open the door to $3,300 and higher. A break below $3,200 may trigger a drop toward $3,000–$2,950. Momentum: Slightly bearish in the short term as we've hit the $3245 zone, but long-term structure remains bullish if key supports hold.
After seeing the dump in gold, we expect gold to make a retracement/pullback for market corrections and liquidity sweep This pullback could lead to a continued bullish rally or more dump in gold, still watching market behaviour......updates would be given
just as seen in the analysis, we see a visible path back to 3400's and above .we just witnessed the monthly bearish sweep and it could be time for a continued bullish rally back to ATH
THIS CHART ANALYSI IS A BREAKDOWN OF GOLD MOVEMENT we are at a critical price in the gold market indicated by zones at 3305-3280, it has been indicated in the analysis by a rectangle . if the rectangle region holds us up then we could further hedge bullish but if it doesnt, the market could fall more as bears may take over. Note that there may be slight changes...
As shown in the analysis, 2297 is a key zone whi h extends down to the 2260's on the higher time frame If those zones hold us above then bullish momentum confirmed but if it doesnt hold, bears still have the upper hand in the market Do you agree with this analysis ?
As shown in the analysis, 2297 is a key zone whi h extends down to the 2260's on the higher time frame If those zones then bullish momentum confirmed but if it doesnt hold us above, bears still have the upper hand in the market Do you agree with this analysis ?
We saw gold on a strong bullish momentum which surged the market in a bullish trend for weeks followed by a sudden dump which has been highlighted in this analysis. Note that this dump could be retracements for continued buys..... 3266 is a critical zone


