entryspecialist
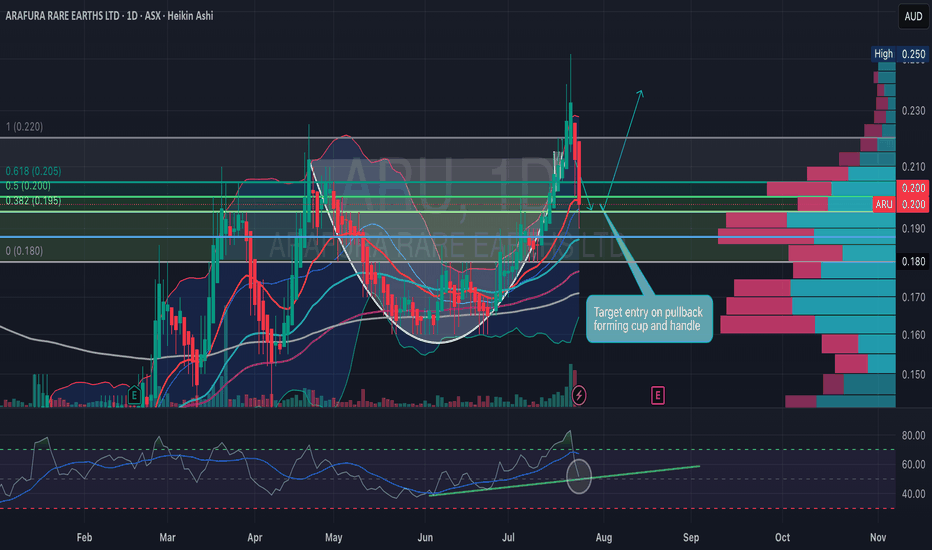
EssentialARU is setting up beautifully with a classic cup and handle formation on the daily chart. This is a well-defined bullish continuation pattern with strong convergence across technical indicators, price action, and volume structure. Key pattern breakdown : - Rounded cup base formed over April–June. - Price rallied into resistance (~0.22-0.23c AUD), forming the...
The price is currently testing resistance around 0.63, after rising from 0.575. The volume profile indicates high activity around 0.58-0.62, showing strong interest. The EMAs reflect a bullish shift, with the 20 EMA approaching a crossover above the 50 EMA. After a period of squeeze inside the triangle, the bands are beginning to open. The RSI is neutral to...
The Heikin Ashi candlestick pattern suggests a recent trend reversal to the upside, as indicated by a series of green (upward) candles. The chart displays a consolidation pattern within a falling wedge, which has been broken to the upside, hinting at a potential bullish reversal. Exponential Moving Averages (EMAs) show the price is currently above the 20,...
ASX 200 Index (XJO) closed yesterday sitting on major support line @ 7603. Long-term higher highs have previously been established since 2021 indicating overall positive market growth.
SEMI currently sitting on upward trend line within established bullish channel. Previous support line at $16.30 where demand triggered another uptrend to above $17.00. RSI currently within average buying levels around ~56-60% showing higher highs, indicating another potential run back towards previous ATH SP level of $17.54. Aiming to take a long position...
Raiz is heading towards a break out from the current downtrend with potential for a golden cross scenario if consistent buy pressure continues. The SP is currently at support level of 0.39c and has been trading sideways within the range of 0.375 - 0.39c since February this year. 200 EMA is sitting right on the key resistance level of 0.415c, breaking this will...


