Hello traders! 📈✨ Today, we're diving into a comprehensive Elliott Wave Modern analysis on the DOGEUSD weekly chart (W1). With our two-window setup, we are comparing the current market behavior with a historical bullish trend from December 14, 2020, to May 3, 2021. Let's break it down: Right Window Analysis: Period: December 14, 2020 - May 3, 2021 ...
📈 Macro-Economic Fundamental Analysis 🌎 In the current global economic landscape, we see a mixed bag of indicators. The U.S. economy has shown resilience despite the Federal Reserve's ongoing interest rate hikes aimed at curbing inflation. Globally, geopolitical tensions and supply chain disruptions continue to create uncertainties. Despite these challenges,...
Elliott Wave: Analysis on the Amazon stock The price movement is following the 5th wave. The characteristics of the 5th wave are not breaking the trend line 2-4 until it reaches 3523-3601$
🎯 I focus on Modern Elliott Waves (Neowave) because this strategy gives me objective to start entry and stop levels. #BTCUSD 📚 According to the Wave Theory: wave 4 cannot cross generally the bottom of the 1st wave in impulse waves . So, we can use the bottom of the 1st wave as an invalid level for a bearish outlook 🤓 Such trades give a limited risk, and the...
BTCUSD The price will continue to rise !!!! The Elliott Wave to form is a corrective zigzag abc or Impulse 12345
1W Bullish is still dominant 1D The counter of the bearish trend is here, a sign that the price movement will be bearish 1H Wave A and the end of wave B are already present, going to build a bullish wave c Conclusion According to 1H the price movement rose around 11216.47. If price increases occur, the situation in 1D does not change, counter bearish trend...
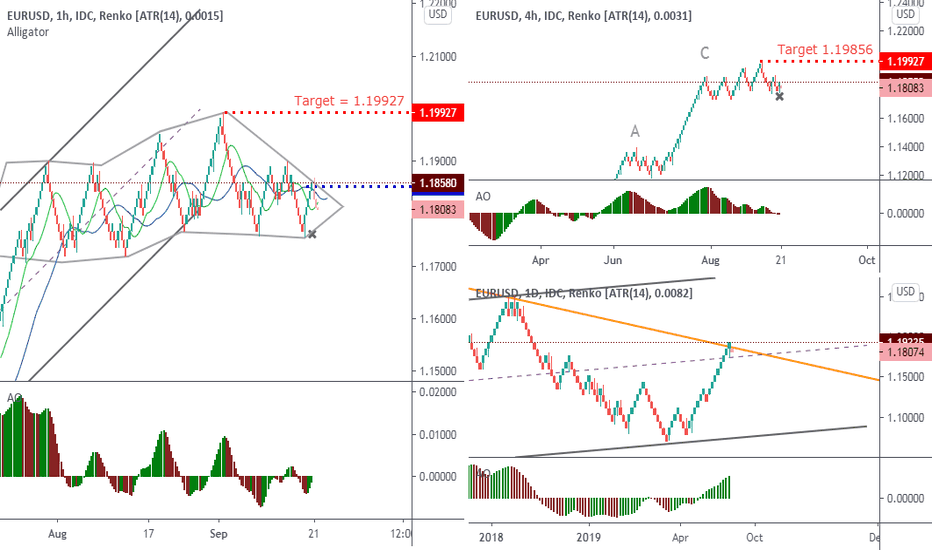
The price will move up, set up long with the target 1.19927
Wait for wave E first, until it goes up there is bullish. Elliott Wave analyst Go long when the price breaks the line at 1.1875.
Bitcoin Market 2020: NeoWave Analysis - Will occur bearish
POLYBTC : NeoWave Analyst Double Zigzag. Wait until 2-3 waves are formed. Will it be a combination or triple pattern?
NeoWave, 5th Failure + 3rd Extension within Terminals 5th Failure Terminals basically mimic 3rd Extension Impulse patterns. 3rd Extension Terminals This pattern takes on a strange and difficult to interpret structure that is usually discovered only after its conclusion (or shortly before conclusion if the pattern is large enough). This is what an Extracting...
HRL :NYSE HORMEL FOODs CORP. Elliot Wave Analysis Hello Traders! From a technical point of view, the stock may have completed the bullish impulsive structure (12345) + a corrective structure ( ABC ).
XAUUSD -2h : Trading Rectangle Pattern Good morning Traders! My idea example above illustrates a "Rectangle" pattern from the XAUUSD 2 hours chart. XAUUSD traded in a tight rectangle channel with highs and lows bound by two parallel trend lines. The prior direction before the "Rectangle" formation was upside. A "long" trade is entered above the blue line. ...
EURJPY - Currency Trading - Forex Market - Harmonic Pattern Technical Analysis Technical Analysis ------------------ Trade Period: Intraday Trading Currency Pair: EURJPY Time Frame: 45Minutes Predicted Direction: Short Trade Based On: The Bearish Bat Pattern or The Bearish Crab Pattern (Harmonic Patterns) Another pattern : Diamond Pattern I...
YY INC Stock NASDAQ -H1 Bearish Continue Rectangle Formation and Short Setup Description: FXAndalanBangsa found a Bearish Continue Rectangle formation on H1 Chart Timeframe. Trade Period: Intraday Trading Instrument: YY INC Stock NASDAQ Time Frame: H1 The trend in the Timeframe: Bearish The trend in the Daily Chart: Bearish Trade Based On: ...
MMM Bullish Shark Market: MMM Time Frame: 240 Predicted Direction: long I will order pending buy stop at @192.11 goal @204,35 SL @182.89 MMM updates will be available in the comments section below. The brief trade analysis presented above is my predicted direction and requires multiple different indicators and confluence factors prior to...


