The most bullish possible scenario I can imagine for BTC on the charts would require a decline to 4,500 to 5,500, with that low coming in the first quarter of 2020. Should this construct form I will identify its parts at a later date. But for now, if you are really bullish on BTC you should exercise patience. Do not be eager to catch this falling knife. When all...
The completed descending triangle has targets of 8154 (met), 6529, 7169, and 5750.
Bitcoin is forming a descending triangle pattern on the daily chart. Note that the rallies within this triangle have been on diminished volume and then volume spikes, representing volume, enters in at high points. The descending triangle is a default bearish pattern, although upside resolutions occasionally occur.
SGX Nifty is forming a possible inverted H&S bottom. I prefer necklines that are horizontal. Down-slanted necklines on inverted H&S patterns add doubt to the situation. Nevertheless, bulls should be on the alert if this H&S is completed with a wide bodied green bar.
The Nifty is challenging the multi-year parabolic curve support line. A close below 10,525 would indicate a much deeper correction could occur. The weekly chart exhibits a possible right angled broadening pattern. These patterns typically break out of the horizontal boundary. Should the parabolic curve give way the target for the Nifty would become 8250.
The parabolic curve on the total crypto market cap daily chart (log scale) has been clearly violated. This would imply an 80% decline back to the late 2018 low.
This 10-month chart construction is known at a bearish continuation H&S formation. The target of this pattern at minimum is .01700 based on a log scale. Based on an arithmetic scale the target is .01000.
Bitcoin should reach $80,000 by early 2020
This pattern implies that the USD could lose substantial ground to the Yen. This could become a BIG trade.
Must stay long while parabola continues to unfold.
A massive H&S bottom is unfolding in the Corn market due delayed plantings in the major Corn growing states. Corn has already completed a very rare V-extended bottom, accompanied by a series of potential breakaway gaps.
Indian investors who are self-assured that portfolio insurance will protect against market losses should be very, very concerned. All major stock markets, including the U.S. have unsuccessfully tried stock market insurance. The result in the U.S. was the 1987 crash.
A detailed chart analysis of the Nifty has been posted on the Factor member site. www.PeterLBrandt.com
The Nifty is losing upside momentum. Resistance has proven strong. I thought maybe the ascending triangle could be completed, but it appears to be failing. Whether we have one more leg up or not, one thing I know for sure. Indian investors who think some insurance company will keep the market from going down will be sadly disappointed. Insurance against declines...
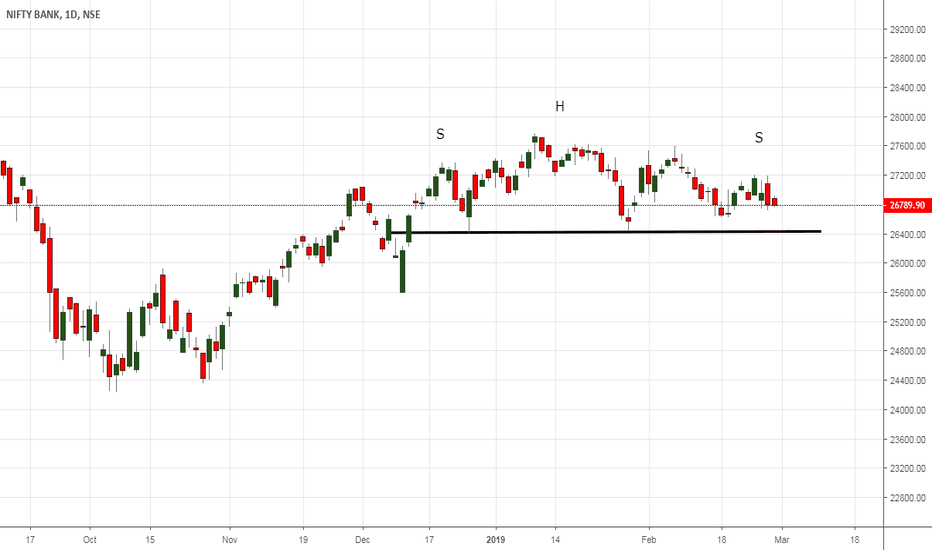
The burden of proof rests with the bears because the parabola remains in tact, but the right shoulder could be rolling over in the $NIFTY
Watch for dip into a better right shoulder low, then a move through the neckline will launch a strong counter-trend rally. Monitor @BitcoinLive1 on Twitter for follow ups.
Narrowest 10-day range since April 2017. Wyckoff would classify this as Hinge behavior.


