fib1337
LIT is about to break out from the strong demand zone. The chart shows little resistance so once the price starts moving up, it will fly! First stop will be $13-$14. I consider this trade as low risk because of the strong demand zone. Stop loss not needed, exit the trade when a weekly candle closes below the demand zone.
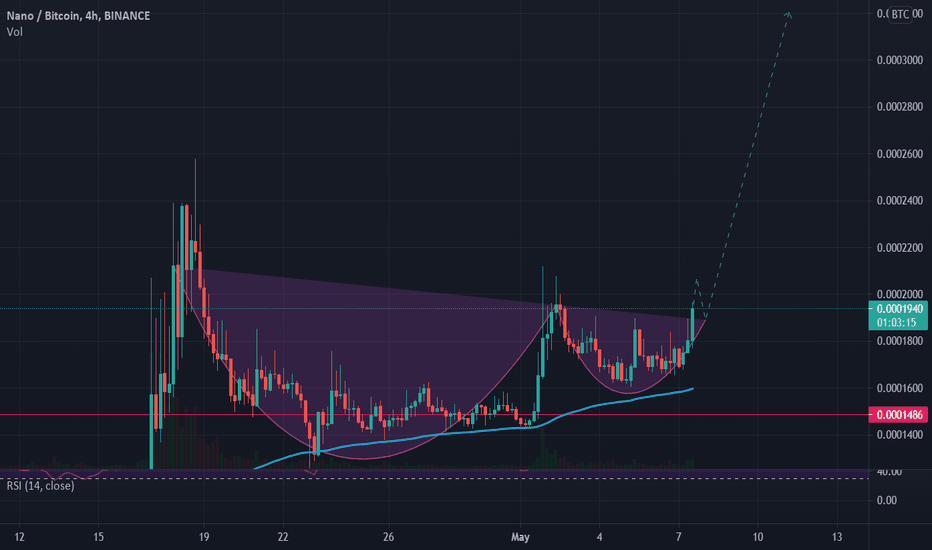
Spotted this tradable pattern on NANO BTC. It's not a perfect cup and handle but it should work out when bitcoin is bullish. I'm entering on the retest of the neckline!
Entry: $61224 SL: $60500
BTC is bouncing from very strong ascending support. Simultaneously it bounced from the 4H EMA21 which is also a bullish indicator. It would make sense to complete the 5th Eliott wave from here. Cheers
XEM has been trading inside a symmetrical triangle since the start of the year. It almost broke out but failed because of the simultaneous BTC dump. XEM is trading on the lower boundary of the triangle and is approaching the upper boundary again. The timing of a retry is perfect because BTC is (or almost is) bouncing from the daily MA50 and long term ascending...
BTC is approaching its long term support and the MA50 as well. Both are very strong support. I think it will send BTC to 70k.
REN shows a strong accumulation zone and recently finished its correction wave. Closing a daily candle above the MA50 will be a strong bullish indicator. Long with tight stop loss.
See the chart for my idea. I'm long until 64K with Stop loss at 54950.
Noticed this pattern on BTC. I think the symmetrical triangle will send us to 63k. I think after that that the rising wedge will send us to 48k. Stop loss on the long is 54950$.
Please keep in mind that the CME gap will most likely close. It happens 90% of the time. This will get us to a minimum price of 58445 ranging to 58995.
LIT is trading inside a symmetrical triangle which is a bullish pattern . It has also started to form a cup and handle pattern. One of the most bullish patterns. It will first see some more downside, but if the pattern plays out the break out will be huge.
See the chart for my idea.
BTC has been respecting the supporting trend line since the begin of March. This trade is based on the idea that this support will hold. Trade invalidated if closing below the MA100.
ANKR is leaning bearish as a symmetrical triangle formed and it does not have much support. High risk long opportunity.


