I recently shared a post which illustrated how to use the OBV (attached - please review) which showed us how and why it is useful. In short, it combines cumulative price direction AND volume and helps illustrate where critical relative volumous price action takes place, relative to that which has taken place before it. In this chart we can see that once...
Bitcoin's Market cycle - One of the most defined textbook examples of the market cycle cheat sheet we may ever see. The chart is self explanatory showing the cycles we went through and the final phase we are now completing - Return to the mean (which is the center line of the pitchfork using candle sticks) Well this is how i will remember it anyway:) I will...
There is some similarity between 2017 and 2019 in the way in which we bottomed from $5k->3k 2017 and broke back to $5k. It took a lot longer this time in a bear market. Overlay & Extrapolate that trend and Dec 2019 could be fruity if we can get over the Tether risk (which is significant at this point and i am very cautious about being long until there is more...
Ok so this is an unusual unforseen scenario. This is how i plan to play it at this very early stage, preempting the information. I have gone to cash (actual fiat not USD) and i am expecting a sell off on the BTCUSD fiat pair. The reason why is because those people holding tether will want to hold fiat while there is risk in tether. The way this will be...
Bitcoin continues to show signs of strength. The Short positions at Bitfinex are now higher than those that preceded the breakout which took us from 4-5k The Long positions at Bitfinex are now the same as those that preceded the breakout which took us from 4-5k Bitcoin continues to grind up, without sign of there being any leveraged positions being taken up...
Bitcoin is once again knocking at the door of $5k. Most of the commentary is on the chart but we now also have a clear inverse head and shoulders bottom. There may be volatility ahead - the bulls must flip previous resistance now into support and attempt to stay about across the $4055 at finex ($3950 everywhere else). A failure here will likely see us backtest...
When you look at the whole picture, bitcoin seemingly has Demand being > Supply in the 3k range. Granted we only have two periods now to look at but the ranges are aligned in terms of where there are clear areas of support and resistance.. aswell as those where price simple carves through. A Bitcoin higher high above $4250 would imply a void in volume through...
OBV is a lesser used, but particularly powerful indicator because it incorporates volume and price direction. A break in the trend of the OBV has been very successful for me in the past in identifying what is goin to happen next ahead of time and is always used alongside moving averages and/or support and resistance. When i have ignored the OBV trend change and...
Its no wonder there is such a debate as to where we are at. Ive unfairly missed out another 2018 attempt but it is what it is. Let me know where you think we are at!
IM sure its nothing, right guys?
Would like to see a quasi Inverse H&S form here, finding support $3400 - $3500 at key fibs, which would also complete the Adam and Eve. Volume Profile is not really there unfortunately Fail to find support; its bad news for the bulls and we will retest lows, certainly $3200s and failing a strong reaction we will go deep into $2000s.
FURTHER TO THE LITECOIN ANALYSIS SHARED LAST WEEK, THIS IS QUITE UNREAL HOW SIMILAR THE SCENARIO IS PRE HAVING. SOME SAY COINCIDENCE. I AM NOT ONE OF THOSE PEOPLE.
Hi Please see my Q1 Macro Chart for more details.
Is this giving us a clue as to what is going to happen with this market? Something im paying particular atttention to. LTC breakout (halving led) happened 2 weeks before Bitcoin. LTC double bottom at 20$? BTC 3k? :)
Hello – This is what im seeing with BTC at present. Bitcoin continues to consolidate; Bounces off prior support yielded a c.61.8 recovery through consolidation, being capped by what is now solid declining resistance >1 year. The consol. Occurring at 3k is showing similar behaviour to that at $6k, the corrective period so far in 2019 is the least severe in...
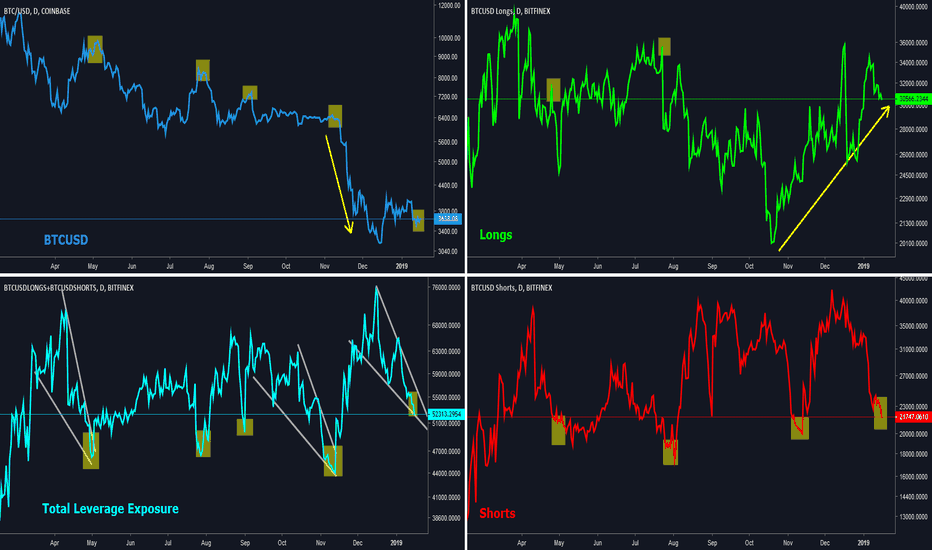
Total leverage exposure is starting to reach towards lows which have been seen at each previous top preceding a dump in this market. Longs have increased from 20k to 30k from $6k Shorts are reaching the 20k lows which we have seen in advance of each previous dump Conclusion – Retest of 3k coming.. eventually it will be but prly need to clean these longs out first.
As described on the chart, we are caught in no mans land, not very good place to be trading, particularly when you are battling bots. Much easier to trade the outcome of the break rather than try to second guess it. Im still overall bearish but aware we may need to go higher before we go lower. It will be brutal to go up towards 4k and then fall straight...
Reatil being trapped into short IMO. Either way, i would rather short this from between the 1.618 target and the A&E bottom target where there are still large unfilled short orders.


