fo0
IOTA may be starting wave 3 on the hourly chart. Waiting for confirmation of it breaking through the .618 fib level at .000323 before opening a new long. Targets at the 1.618 level and 2.618 level with a stop loss at the .382 fib level. This is not financial advice. I'm new to this. Trade at your own risk.
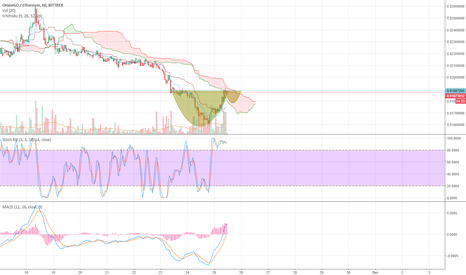
Daily looks like it's formed a cup and handle. Could go to resistance at .0265 This is not financial advice. I'm new to this. Trade at your own risk. Good luck.
It looks like we're possibly in the middle of wave 3 on the 4 hour chart for IOTA. FIB Retracement is there for my own education. I'm long on this until it breaks the trend, I expect a brief correction in the next 24 hours before it continues its move up. This is not financial advice, I'm new. Trade at your own risk.
Lisk has been forming a head and shoulders on the daily for a some time now. The right shoulder is still forming. Neckline is near the .000616 level. If it breaks it can free fall to the .000095 to .000080 level. This not financial advice, I'm new to TA. Trade at your own risk.
There's a head and shoulders on the daily. If it breaks the neckline it can fall to the 1.618 fiv level at 1231. I'm new to this. This is not financial advice. Trade at your own risk.
Lisk is forming a massive head and shoulders on the daily chart. If it completes and breaks the neckline, the bottom may fall out. Support at .000089 level. Something to keep an eye one. I'm new to this, this is not financial advice. Trade at your own risk.
Descending triangle on Sys Coin on 4 hour chart. Looks like it wants to break through soon. 2 Targets based on past resistance levels. This is not financial advice, trade at your own risk.
Looks like BCH may be breaking out of a short term downward channel on the 30 minute chart. Stoch RSI confirms upward movement. If Candle closes above channel I'm looking at the .618 fib trading target in the short term. I'm new to this and this is not financial advice. Trade at your own risk. Good luck.
Looks like a bull flag pattern on the 60 minute chart. Possible short term trade opportunity. Fib placed just for my own testing purposes. I'm new to this, this is not financial advice. Trade at your own risk
Bearish divergence in Stoch RSI and price. It could bounce off the cloud here or it could fall further to find support at the 0.0165 level.
Looks like an inverse head and shoulders pattern could be forming in the short time frame. If price breaks through the neckline we could see some SHORT TERM upward movement. I'm new to this and this is not financial advice. Trade at your own risk.
Parkbye head and shoulders broke neckline. I'm short on this until it reaches .00008811 support level or another reverse signal. I'm still learning and this is one of my first ideas, this is not financial advice. Do your own research and trade at your own risk.
To start with this is on a 30 minutes time frame, very short term. I see the first elliot wave completion. But the larger wave 3 looks to be beginning here. The Stoch RSI is showing over sold and reversing. The MACD is poising to cross the signal line and price bounced off the cloud. I'm still new to this so this is not financial advice, trade at your own risk.


