After analysis of BITCOIN, I found much symmetry within the Crypto-kings trend. These large spikes most likely have to do with traders getting in and out and new money trying to use Bitcoin as a trading currency (not investment). As the broader market becomes welcomes more "Traders" we should continue to see people riding the trend. I believe this is a day/...
After a parabolic move one should expect a pullback at some point. When researching BTC price history, I noticed a very familiar parabolic move that I normally see in high flying biotech stocks. I outlined a potential double top about a week prior to selloff “Hold on to your pants” and “Have you seen San Andreas” and have been enjoying massive gains from going...
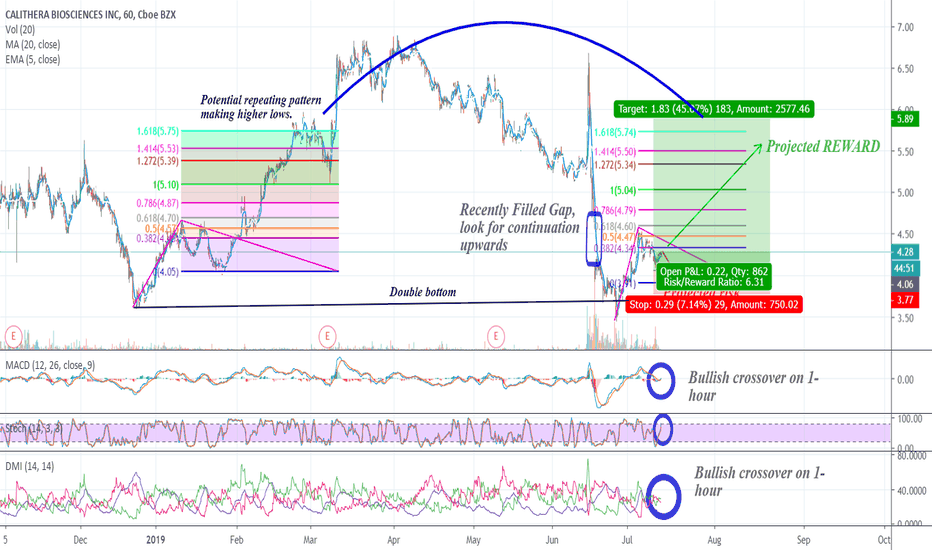
After a recent selloff in mid June 2019, Stock price went from from $6.70 down to $3.44. Cala looks to have established a double bottom. New strong uptrend suggests it has potentially capitulated from the selloff making these levels very attractive for any investors who are sidelined and looking for a good technical/ fundamental trade in biotech. Cala looks to be...
Closed swing position. Just re-initiated short position - potential double top testing resistance right on target. Risk/ reward is huge at this point. GL everyone. I’ll be watching closely next couple days =)’ LOL Disclaimer: this is not a note to buy or sell. Please do your homework before investing
Downside: - ARTX has been forming a long term downward channel on the weekly chart Upside: - RSI is at 27...signalling an oversold condition - Over the past 11 years, when ARTX reached an RSI <30, it ran >250% twice - Current price is near the bottom of the downward channel - The $1.92 level has served as support twice, and now appears to be resistance, I am...
- looking for bounce Looks like price is just about ready to break resistance. Could be nice risk reward trade. On a potential breakout, watch for potential double top. Levels to watch SL set to $16.50 Profit exit between 1.272 and 1.414 to let it correct (this is also $19.87-$20.25 range. please like and follow so I can continue sharing. Thank you...
Recent data release may have changed SGMO's future outlook. Sangamo's long-term chart suggests a potential pullback to $4 is a possibility, but that was before a recent data release by the company for updated Phase 1/2 Results for SB-525 . This is an investigational Hemophilia-A gene therapy that showed sustained increased Factor VIII Levels with no reported...
Upside: - Ascending triangle forming over the past month - The bottom of the ascending triangle is closely in-line with the 20-day SMA, providing additional support - Inverse head and shoulders set-up forming since early February Downside: - Stock price has failed to break above $10.71-$10.72 on three separate days, potentially leading to a double-top set-up -...
Upside: - It appears over the period of several years a large cup is forming on the weekly chart. The left side of the cup is just above $30, leaving upside from the $24 current price. Downside: - Weekly volume is decreasing, notably this most recent week having very little volume (albeit a holiday week) suggesting buyers may be drying up - RSI is well above 70,...
Have trades for both bulls and bears =) Thank you all for sharing BTW. Case 1: Test/ break above triangle can signify move to $12,000. trigger set for potential breakout. However, I would be watching carefully for potential double top at $12,987-$13,000 at this point. Case 2: Move below white line, good short-swing position. Move below green...
KTOS has had a huge run lately and sometimes its good to ring the register. To watch for future defense contracts for Kratos, check out this site. Technicals: Pattern suggests KTOS has ran its 5-wave sequence. Rising wedge suggests a pullback incoming upside potential $26. watch for sharp selloff if this is the case. on a pullback, support levels...
#VolatilityWatch Text shown in the chart details my thoughts on current trend/ pattern analysis. Bitcoin bounced sharply off long-term level of support. The symmetry within the #currency is beautiful. Pattern suggest that the triangle filled with pink will be the range of support and resistance for now. From a long term perspective, looking for break of...
Eyepoint pharmaceuticals today was added to the Russell 2000 and 3000. The pharmaceutical company has alot to prove this quarter with regards to their loan with CRG, but a earnings beat would spark investor/ hedge fund investment which could give potential massive upside for EYPT and current investors. Why EYPT After EYPT diluted (one of EYPT's pain points) more...
RGNX and Novartis just received FDA approval of Gene Therapy treatment for Spinal Muscular Atrophy (SMA). (SMA)Spinal Muscular Atrophy is a disease affecting the motor nerve cells in the spinal cord, taking away the ability to walk, eat, or breathe. It is the number one genetic cause of death for infants. According to a company filling, price tag for...
check out the article @: msmoneymoves.com this is my opinion and should do your own DD before investing
Do you want better quality of life?? VSTM showing signs of consolidation while being oversold with no sellers in sight. chart indicates inverse head and shoulders, one of the most bullish chart patterns in wall street. As a patient now in remission, I can say unequivocally that TO MUCH TIME IS SPENT IN THE CHEMO WING. Therefore, as patients and Doctors find out...
Recently FDA released data suggesting KPTI and myloma medicationi was too "Toxic" their MM chemo drug had SERIOUS toxicity AEs and even DEATH. Cohort of 123 pts ~86% had some sort of serious AE and ~24% dropped out because of this. to find out more about what happened and why SP dropped, see synopsis in the link below. Synopsis of Data can be found here- opening...


