forex-academy
This chart is released as a poll to measure the traders sentiment bias over a potential inverted head and shoulders pattern. Read more.
Once Gold (XAUUSD) reached to our Potential Exhaustion Zone, the golden metal completed fifth extended wave. Today, XAUUSD lift to the previous consolidation zone. In this post, we'll unfold what to expect from the precious metal for the coming days.
NZD USD 4H is making lower highs and now is in a brink of breaking its 0.63662 support. Price action suggests that there is no strength to push the price to the top of the channel, as the last candle is retracing all the advances of the previous 4H in less than one hour.
Litecoin is moving sideways, but it is on the edge of a structure that resembles a huge head-and-shoulders pattern. A break of the current supports would drive the price to $60. That is unlikely though since supports seems to hold and there is volume in the bullish candles as seen in the 4H chart. MACD and Stochastics point to a movement to the upside....
Ethereum moves inside a triangular structure, but still the underlying trend is bearish. The triangular structure usually is a continuation pattern, so the main scenario is for ETH to continue descending. MACD and Sthoch are pointing to this diretion. A potential movement above $195 would be a good trigger to go long, as the last bullish candle show buyers are...
Ripple continues obeying the descending trendline. Currently near the 0.266 level. MACD slightly bearish and stoch. near oversold. XRP seems to try to find a bottom. Volume is low so a buying spike can send hit back to 0.28.
Bitcoin moves sideways in the middle of the range between $9,758 and $10,472. The descending trendline has been crossed, so now it is officially moving sideways. MACD is still slightly bullish and Stoch is in the middle of the range.
This chart corresponds to our mid-term outlook-
In the long-term, the USDCAD pair shows a corrective sequence. During this year the pair eases 2.70%. In this post, we'll review what to expect from Loonie for the coming weeks. Read more...
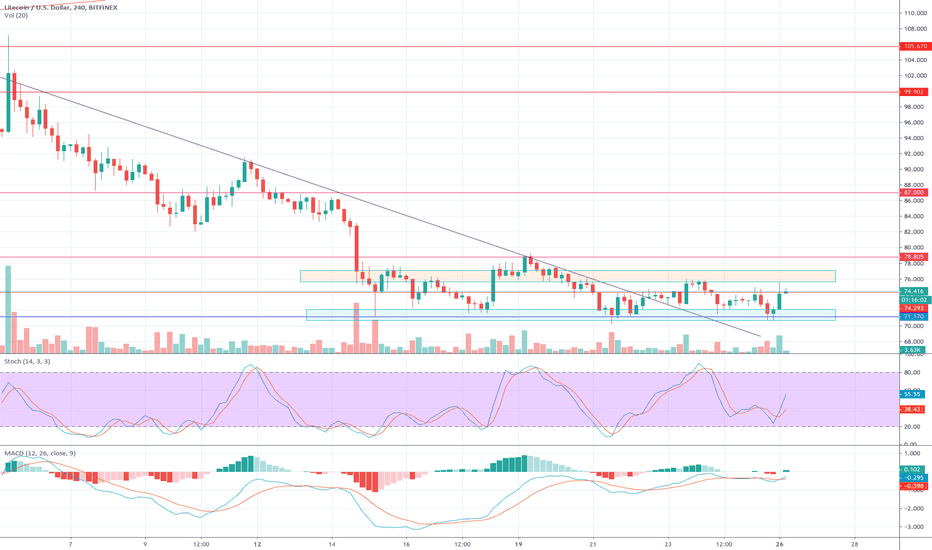
Litecoin is moving in a tight range. It also shows the same morning star figure as Ethereum and also the MACD and Stoch. signal upside push. The overall trend is downward, though. We would like to see the price convincingly above the resistance area to assess a trend change.
Ethereum has been moving sideways but the recent kind of morning star figure with strong volume and the technical indicators signal a potential upside.
Ripple is moving sideways. The descending trendline has been broken and now the price moves between 0.266 and 0.276. The technical indicators seem to point to an upside movement.
Bitcoin price is constrained between $10,000 and $10,400 as these areas act as triggers for buyers and sellers. The good news is that the $10,000 support is stronger than bears thought it was. MACD, Stoch. and Volume seem to point to the upside.
This chart corresponds to the third chart of the post "SPX - We are facing a Bear Market?"
This chart corresponds to the third chart of the post "SPX - We are facing a Bear Market?"
The last drop in stocks markets and a recession fear makes us suspect if we are facing a bear market. In this post, we'll review the current bearish sentiment and what can we do in a bear market.
The last drop in stocks markets and a recession fear makes us suspect if we are facing a bear market... Read more.
During this year, Bitcoin (CME:BTC) futures climb 180.24%. The current structure of BTC suggests that price could visit a new high. Follow us to see our perspective for the greatest cryptocurrency for the coming weeks.


