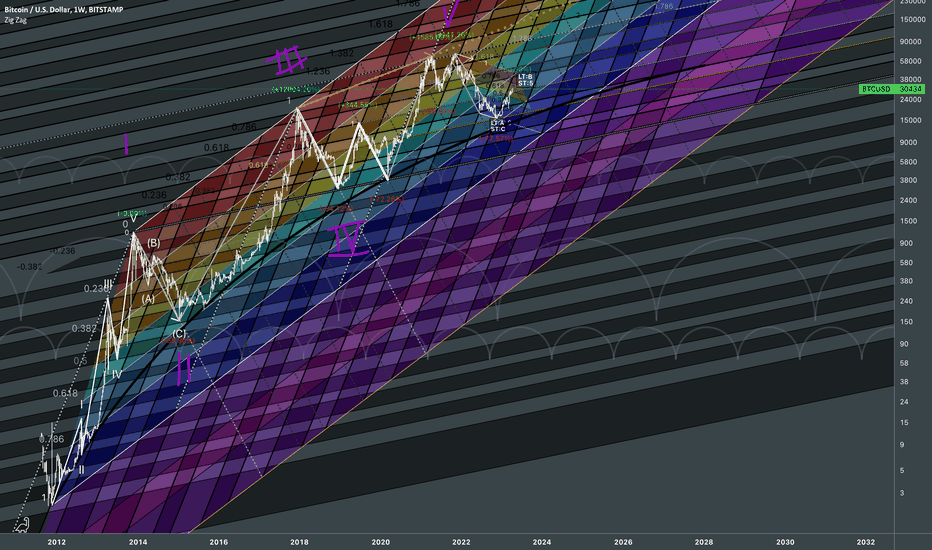
Relating common behavior with fibonacci channels on log scale. Interconnectedness: Top of housing crisis fall ⇨ Current ATH (0 line - direction) Bottom of housing crisis (1) sets the related range projecting into future. Also considering different tilt: Top of precovid crash ⇨ Current ATH Bottom of Covid19 crash (1) And its derivatives 1.236 +
Breaking down the volatility & cycles in terms of Fibonacci ratios. Market rhymes with golden ratios adapted to the average angle of its waves. Having the golden rule interconnecting the history to the present, it allows projecting its domestic randomness into the future. So the only subjective component of this idea would be coloring which mimics the LT momentum....
Original: // I believe the 2023 bullish wave has been approaching the local high which is at fib sequence level relative to falling sequence. This looks very overbought for a pullback even from general decline perspective (TimeFib 0.618 - 1). I mean that wave has already caused desperation for many who bought high, so they lost their confidence and will...
Just a cleaner zoomed in version of Bitcoin Fractal Dimensions II with important visualized details. Since we've already covered the point of my irregular use of fibonacci channels for simulating the market, it's time to break down the candle data even further to justify whether Fibs are priced in at the right levels. I'd qualify this as a bullrun if price...
% 🕘 Fibonacci Reversal Zones give awareness about interconnectedness of historic patterns all the way to current candle. Projecting how one wave can be relative to the other using various Golden Ratios derived from waves of notable cycles. Application of chaos theory behind the nature of the market in Fractal Geometry. Long-term alertness for Violet Area: Why?...
Followup on: Justification of zones with fibs Covid Drop Fib Echo Back: 2020 to ATH: ATH to local bottom:
Extended to left: Fib Sequence config referred to a fractal with similar type of exponential growth: Buying & Selling Pressure falling together because sizes of bullish and bearish candles got smaller. H&S Pattern: Next breakout can be confirmed with BSP ref.:
Mid-term oriented followup on: FIB Rhyme to COVID19 drop: Closeup:
Each transition (price action) gives a frequency to a motion of upcoming waves. Fibonacci Ratio sets Volatility in terms of %🕘 blocks Fractal turning point: Fib echo back Downward spin of the trend in relation to ATH: Fibonacci spiral exponential growth simulation: Price is at golden ratio so must be a turning point for upcoming high momentum. Next groups...
Psychological scheme for trading/investing in USDRUB WHEREVER PRICE MOVES - the most spectacular pair to deal with.
Fibonacci time zones of yield curve cycles show reversals.
Result with similar angle of fibonacci channel: Echo back to the rest candle data:
This scheme may work out IF PRICE DOESN'T go below 3k ANYMORE. If it does, then fractal justification collapses! More works and timing estimations:
Twenty-year channel of continuous Support and Resistance price levels. Cold colors = Demand Hot colors = Supply Current Price is around 0.618 of the Fib Channel. We can see how market reacted after getting close to Golden Ratio. However, if oil stays expensive for a year above $68 a barrel, that might pull USDRUB down to a deeper demand areas.
Breaking below red curve and staying below it will cause bearish takeover of the market,
TimeFibs: Historic rhymes of the base angle:
Timing related Fibs: Relatively price oriented Fibs: I know I should have put 0 on top but it would complicate things. Since 0.618 x 0.618 ≈ 0.382, we'd just put emphasis at derivative. Cycle based angle indicates golden ratio just upper to the current price. Wave Interconnectedness: However I'd focus on relatively recent price levels. Lines will act...


