franklyfresh
PremiumVix fell slightly as SPX closed the week relatively flat. FMOC made it clear the Fed expects economic harm from current plans despite unwillingness to update guidance on rate cuts. Forthcoming April 2nd tariff war milestone will likely cause the market to simmer further in anticipation of the execution. Major tech earnings have concluded and the market enjoyed...
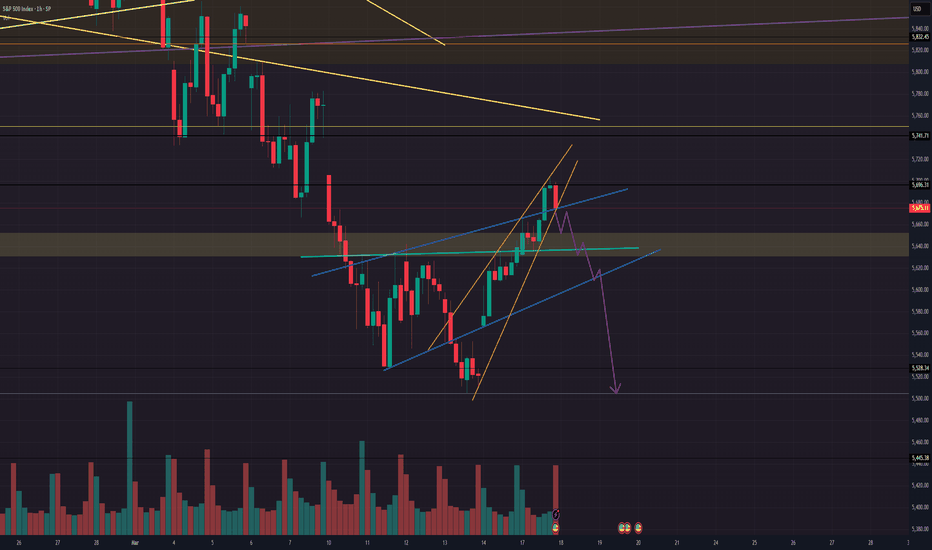
Spotted an aggressively sloped rising wedge on SPX near the bottom of the recent correction. Theoretically, the more positive slope of the lower support compared to the upper resistance indicates buy-side pressure exhausting at a faster pace than sell-side pressure. Once bulls are exhausted, bears can reclaim control of the trend confirming the continuation....
Valid inverse H&S currently forming on SPX. Need to watch for volume expansion at break of neckline to confirm.
RCAT has completed the formation of the head with a bounce at neckline and is currently on the leg up for the right shoulder formation. Watching for continued volume contraction as the right shoulder forms for further bearish signals. If instead, volume expands, (especially further than the left shoulder formation), then I will be watching for bullish...
Practicing here & publishing for prosperity in case this voodoo fib time series actually works. Confluence, directional, range, yadda, yadda. Fib time zone marks potential reversals or major inflections using fib time series. Using the drop from 108k to 89k marked with yellow circles, the fib time zone predicts another major inflection on Sunday, Feb 9th on the...
Tomorrow, LXRX will be sharing Phase 2b topline results of their LX9211 non-opioid analgesic for DPNP. LXRX stock has declined 38% since their earnings miss & divestiture of Sotagliflozin in Nov '24. With significant float lock up, high short-interest, and a potentially positive readout, LXRX is poised for a major move to the upside. PT1: $0.96 PT2:...
NVDA has been respecting this bearish channel since Nov '24 with 5 touches on the lower trendline and 4 touches on the upper. NVDA most recently bounced off the lower support, making the 5th touch, and gapped up with the indicies to reclaim the midpoint of the channel. With the midline acting as support, movement towards the upside of $127-$130 is much more...
Anticipating selling pressure to continue into weekend with SLD/OPEX headwinds. ES broke below key 6030 level and will need to find support above 6k to maintain bullish positioning. SPX closed the week at 50EMA but a failure and Monday open below 6k likely leads to downside opportunity at lower trendline around 5960-5970. Positions: Feb26 6,000P
AGl broke Nov 24' high / resistance. Looking for upswing formation
Just practicing charting. Invalid H&S Bottom on PLTR that would create a measured move to $100 at breakout of the neckline. Unfortuantely, I do not believe this is a valid H&S Bottom. PLTR is at ATH and looks to be searching for the next level of resistance. At this point, macro factors will likely play the most significant role in the direction of PLTR but if...
bullish options chain with rising wedge. looking for 27.50 breakout for 30.00 price target.
Positive sector sentiment & bullish options chain look juiced to $22 PT
PG set up for bounce. Staple goods. Looking for reversal confirmation.
Some strong support but still potential downside to complete the pattern.
NASDAQ:HIVE in a critical spot to watch to determine market direction after significant period of consolidation. Looking for break below blue trendline to invalidate. Looking for convincing vol to break $4.20-$4.70 resistance and test of purple trendline for breakout.
Potential double bottom reversal formation on BYND. Not confirmed, need convincing volume expansion on leg up. Early signals of formation.
Ugly chart. Need convincing volume to breakout from handle/pennant. Forthcoming announcement on ATR drug candidate (ATRN-119) may drive price action needed.
Need to wait for confirmation of breakout from flag/pennant. Q3 provided bullish fwd guidance for Q4 which reports Feb '25. Fy25 will have a product portfolio with incremental innovation to grow vs. base period. Fy23 data breach issues mostly in the base period now.


