green_brow
Looks like we might be bouncing up, but if we start to turn down we are forming the right shoulder of a pretty strong head & shoulders pattern. I would exit longs if we pass the support area around ~850. Otherwise looking toward 1000 then 1200
Following a pattern of 150% to 200% pumps followed by a 45% drop and accumulation period. We just went through the drop and had a sudden strong breakout. Similar increases will take us to 0.90 cents, and $1.00 acting as a psychological milestone. Watch for a strong breakout above $0.50
At support. 2 levels to watch if it breaks up or down
Chart is looking good. XMR has been a slow and steady performer. Volume is rapidly increasing to new levels.
Predicting price to drop slightly more to the targeted area, around $43 before rebounding, with the upper target being around $60. On the weekly, we met the same strong support of $35 in Dec 2018 as we did in 2016. We topped out just under $54 just as we did in the rebound from 2016. After topping in 2016, we pulled back to about $43 before soaring up to about...
Could not hold support; broke below $94. Next target area is between $90 and $86. Use a tight stop above $95.
At bottom of triangle and 200D SMA. Looking for rebound.
Fell through a rising wedge. Back to previous support; ~$96.00.
Closed after a small bounce off the 50D SMA, just below the 100D. This stock has been incredibly correlated with the 50, 100 and 200D averages. Short-term, Wait to see which direction it breaks (above 100 or below 50) and long/short appropriately. Long term, still very bullish. Global uranium demand is only set to increase drastically, as well as being the only...
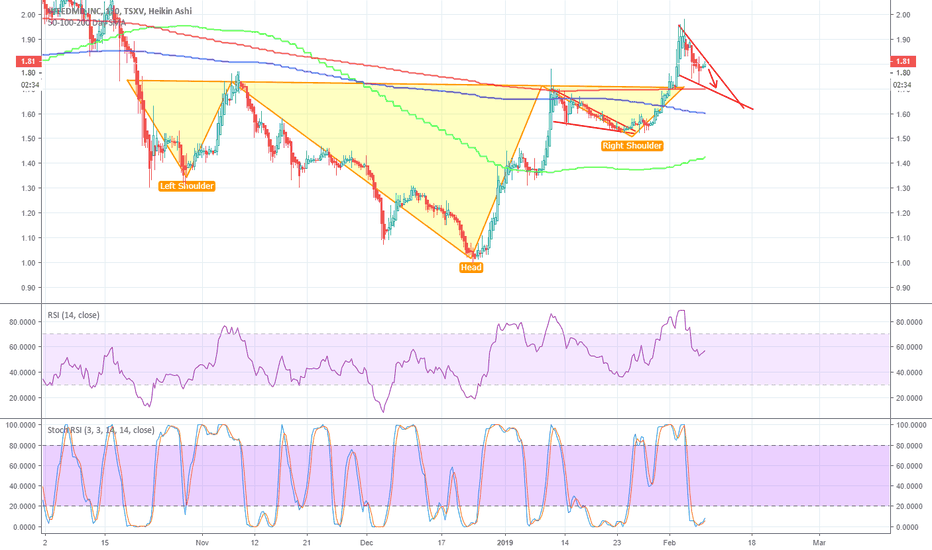
Burst through H&S and previous resistance, forming bull flag. WEED closed +1.5% today, with WMD closing -0.5%. Divergence between these two never last. Likely pullback to 200D SMA (last support), before breaking through bull flag.
Reject off 200 D SMA, RSI approaching oversold, stochastics bearish cross. Pull back to previous support; the 50 D SMA. Somewhere in the region of 6650.
Just thought I'd share something I found a little interesting. I was looking at the ETH/BTC chart and switched it to log scale. Then I through a pitchfork in lining up the two huge run ups. An whula - it lines up perfectly! The upper line fits resistance twice, while the inner pitchfork lines act as support/resistance multiple times. And now we are hitting the...
Dumped hard from the top of the rising wedge I outlined in my last analysis. Has found some support at one of the previous key demand areas, which coincides with the 78.6% retrace. Looks to have formed a flag now, which can break either way. RSI is near oversold on the daily, but the 4h Stoch is forming a bearish cross. If I had to bet, I'd guess it's going to...
Daily MACD bullish cross, Stoch RSI moving up, huge bullish divergence on the RSI while still being near oversold. Found support once again on the 23.6% forming a double bottom. Earnings report coming at the end of the month. Expected growth from Q3 last year is 11%.
At the bottom of an ascending triangle. Also back down to the 50 SMA, which has been a key level of support for months. We still dont have a bullish confirmation on the Stoch, BB, MACD, and the RSI is not oversold, so wait for a bounce upwards to confirm reversal. Otherwise, this could be breaking down. From a FA perspective, UUUU is looking very strong. As the...
Upwards breakout rejected. Short down at least to lower support line, in the $2.75 region depending on its rate of decline. Bearish cross on the daily Stoch, RSI very over sold. PPO moving down with some bearish divergence. Also remember that a rising wedge, particularly after some strong downward movement (as has just happened with PONY) is a bearish trend, and...


