gunhy
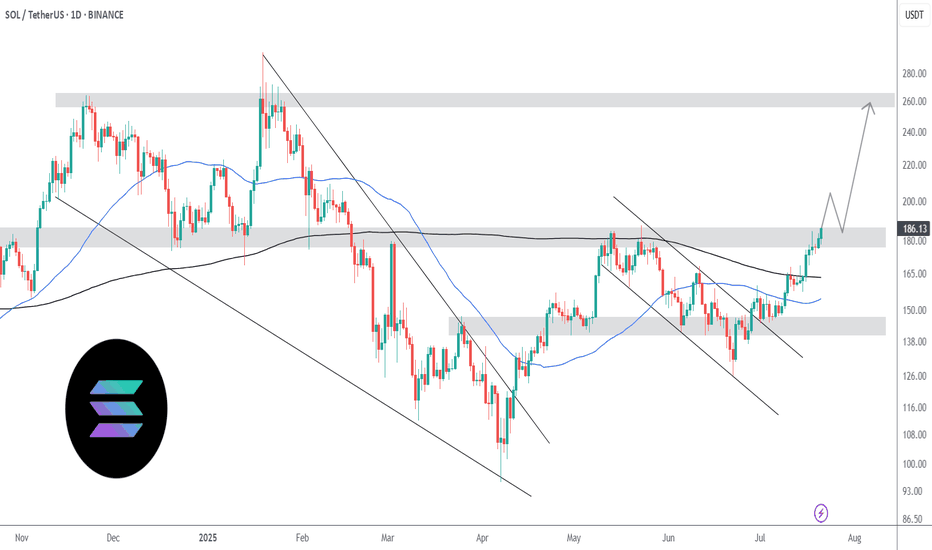
Solana is slowly but surely grinding up, following the altcoin king ETH. ETH is already near its 2024 highs of $4000. If SOL were to be in the same position as ETH in terms of price, we should be around $250. In technical terms, SOL is showing huge bullish strength at the $180 resistance. In the last attempt in breaking above this level, it faced multiple...
In my previous idea, I anticipated a liquidity hunt below the $140 level, and price action played out exactly as expected. SOL wicked below this key support zone, triggering stop-losses and inducing panic selling — classic behavior before a major reversal. Following this sweep, price quickly reclaimed the range, breaking out of the downward channel, and is now...
Geopolitical tension is causing fear in the markets. Today, Bitcoin fell from $107.7k to current price $105k with no sign of buyer support whatsoever, printing 11 consecutive H1 red candles intraday. Like a hot knife through butter. At $105k, there is very little support. Sell volume absolutely overshadowed the tiny buy volume. Bulls have yet to close a green...
After 2 months of consolidating within a descending channel, Bitcoin has finally broken out, confirming a major technical breakout and shifting the structure back to bullish. The breakout was followed by a clean retest of the channel resistance turned support, which is now acting as a launchpad for the next leg up. 🧠 Technical Analysis: Descending Channel...
Bitcoin is currently retesting the broken downward channel. This selloff was a market shock reaction due to Israel's airstrikes on Iran. Price found support around $103k, at the daily timeframe 50SMA. The daily 50SMA also served as support in the previous drop to $100k last week. In the chart's red circle is likely where many long leveraged positions had their...
SOLUSDT is currently in an uptrend after recently breaking out of its extended downtrend to $95 which took out millions of long positions. Now, we are seeing yet another extended downtrend on the lower time frame, but the overall direction is still up. Last week, price action printed two very bullish pinbars at the $155 level which could have been considered...
Today, we got reports that the SEC requested SOL ETF issuers to update their filings which ignited the rally past $165. This boosts investor confidence- we should see good bullish volume in the near term, targeting $185. US-China talks have also came back positive, awaiting both presidents' approval. The first hurdle, still, is the 200SMA. Ideally, we want to...
CADCHF is on an overall downtrend on the daily timeframe, currently trading in a range formation. RSI is strongly overbought and currently has a divergence with the previous bounce off the top of the range. Looking to short the top of this range with stop loss over 0.635, a strong resistance zone.
Price broke above a rising wedge pattern, indicating massive buying pressure. Now it is retesting the wedge in the form of a bull flag. If price breaks above, it can be an opportunity for a quick buck. This is also in line correlatively with my bullish AUDUSD analysis. This worm might only be caught by the early birds when the market opens on Monday.
AUDUSD broke out of its bearish channel, forming three patterns: -Inverted head and shoulders -Double bottom -Cup and handle Now that price broke above and is retesting the necklines, I think this will be a high probability trade for a fantastic 1:6 risk-reward. Stop can be widened further to avoid stop hunts for a 1:3. I will review this setup at market open.
AUDCHF is on an uptrend. Formed a bull flag and broke out with an engulfing candle. Going for a 1:2, seems reasonable if price action follows the previous similar bull flag breakout that happened earlier on the 18th. Would be smart to lock in profits at 1:1
Previous idea on EURCAD went perfectly. Now we see a new set up in the form of a bear flag / triangle pattern breakout. Breakout was confirmed by an M30 engulfing candle. Keeping SL tight.
Price broke below a support zone, retested it and is now continuing the downward trend. On lower timeframes there is another local support that broke and retested as well. Looking to hop on this move down. Tight SL
RSI divergence, reversal on the trendline confirmed by price action. On lower timeframe we can see MA50 acting as support as well as a bullish engulfing candle. 1:1 low risk trade if entering now. May have more entry opportunities for better risk-reward if price later pulls back to the trendline.
A textbook setup. Following a move down a bear flag formed and now is breaking to the downside. Looking to catch the continuation move.
Within 1 hour of London open, all Asian session gains were erased. Most traders would have entered @ 2618 with SL below the support zone and get stop hunted. Now we see a RSI divergence as well as an engulfing candle which might indicate a reversal to the upside following the stop hunt. Good risk reward of 1:3
Trendline retest, higher highs and lows, RSI divergence. Good risk-reward trade
Price is currently on a retest of the pennant structure. A bullish pinbar printed. Low risk setup with a wide stop loss. Aggressive risk takers may want to tighten stop loss for higher risk-reward.


