Here is my Elliott wave (IV) count. I really can't call it mine. I watch Tradedevil a lot, so of course I borrow and copy things. If you look in the Elliott Wave Principle online book, section 1-9 (1-8 link) it discussed a special ABC wave with a short A and a long plunging C. I think this explains the (W) wave in my chart. Especially considering the 100s of...
Yep, Tether (USDT) printed again. Close to $1 billion USD. And at the same time, BTC started rising. Bad news for the bears, trying to fight this printing press. The chart plots the USDT market cap along with BTC. USDT market cap is around $64 billion. So $1 billion is not chump change.
I plot XRP, Feather, DASH at the 2018 top with BTC to demonstrate this. They were well known back then. Will history repeat? No idea. In 2018 BTC peaked, and some alts peaked at same time as BTC like DASH. But other alts, like XRP and Feather kept shooting up. BTC went down, then retraced back up to 0.707 for the last hurrah. And many alts peaked at that...
Yes, I said 2015 to 2021. This bull run did not start in 2018. It started earlier. How do I know? It has been known to many, that the 2013 fractal matched the current bull run. But there was never any good explanation besides the crypto gods did it. Well there is a more earthly reason. The pumps and retraces of the 2011-2013 bull run hit standard fibonacci...
I've published the 2013 fractal match before. It needs some updating, so reposting it. You can see all the pivot points match with the current bull run. Notice, that the current 50% + dip matches the 50% + dip that occurred in 2013. Notice, that I label five Elliott waves starting this bull run as 2015. I'll post another chart about this giving more...
I think the chart makes it clear. Notice that BTC has a history of reacting at inner lines, which I show on the chart.
The last time there was a divergence between crypto BCH and stock BCHG, BCHG woke up when BCH retraced to 0.382 fibonacci. Let's see what happens this time. A divergence has definitely formed between BCH and BCHG. Get ready to print money!
I just did this bullish Elliott wave count. Probably complete BS, but who knows. I figure my BS is as good as anybody else's BS at this point.
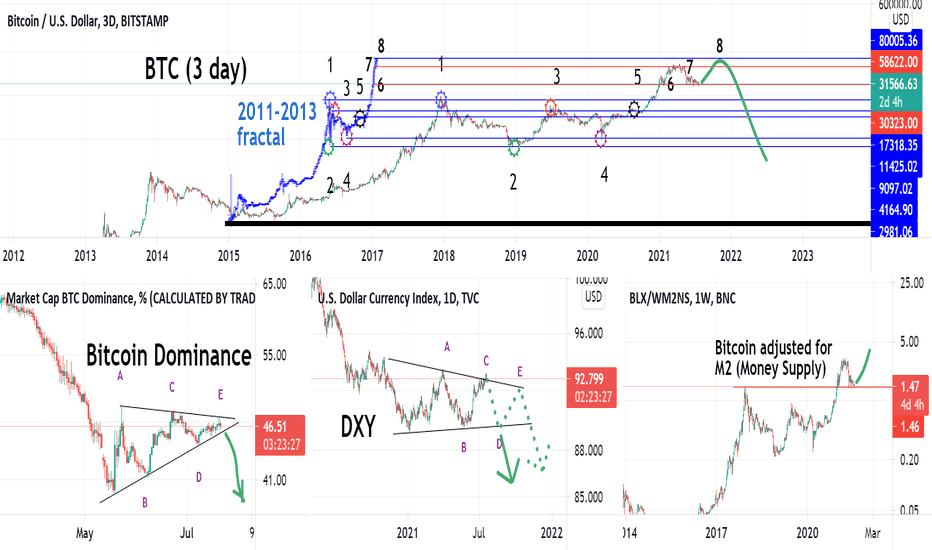
I created this combo chart to get more overall view on how BTC is ready to continue bull run to the market top. 1) 2013 fractal had 50% dip (Nov 2013) just before the last leg up. Fractal matches this dip. 2) Bitcoin Dominance completing triangle. So now it should drop for the final BTC capitulation to altcoins. BTC will rise in price as well. 3) Dollar...
The amazing 2013 fractal just keeps on giving. As some might already be aware, the current bull run has been matching the 2011-2013 bull run fractal, starting January 2015. To get even more amazing, the 50% dip in 2013 matches with the current dip. If the fractal magic can be believed, this dip has reached its low. The top chart would give a BTC top of about...
I made this chart to show the DXY inverse correlation with BTC , if there is a correlation. To me, I see a general inverse correlation. I wouldn't time it to the day or week. Keep in mind, I did not plot BTC , I overlaid a fractal . I describe below how I created the chart. To create this DXY log chart with a BTC fractal: I put a BTC plot on the DXY . Put green...
I show in this video how BTC formed the 7 wave crashing structure as I learned from Blockchain Backer.
BTC fractal theory I gave this chart a theory name as a joke:-) But the chart is not a joke. The chart above combined with the chart below will display how the 2011-2013 BTC fractal is matching this latest bull run, not by time as so many try and force, but by vertical price action levels on a log graph. I learned of this months ago from Blockchain Backer, so...
My Elliot wave count. I lazily placed elliot counts on the silver to BTC chart. Silver is so flatline to bitcoin on the linear chart, that fibonacci is useless on the silver to BTC chart. My take: Silver relative to bitcoin is in the dirt. Great buying opportunity, when you consider politicians think the printing press is this magic thing that spits out money...
Purple line - I chart the stock to flow (S2F) along with BTC price. Below chart - I chart the "stock to flow multiple" (S2FM). S2F price x S2FM = BTC price The S2FM clearly shows a trend line for the BTC tops. The S2FM for the next bitcoin top can be guessed around 2.55 to 2.4. I guessed 2.5 and show it with the horizonal orange line. Notice, that for...
The 2011-2013 BTC fractal matches the levels of current bitcoin. So will bitcoin top out around $80k? This pattern is well known. Just publishing it again.
I place a simple fibonnaci. You see the targets. I never thought of AION as a major blockchain. Never heard of it until recently. But the AION chart shows high potential.
AVAX is a buy. It is about to start the next major wave. I show possible Fibonacci targets.


