Based on wave analysis, the main support line and RSI indicator when the price is oversold below 40, it shows a very high possibility of GTLB reversing to increase. The price now (Closed on 06.16.2025): $42.08. Price target: $47.76/ $50.50. Stop loss: $39. !!! Important note for stoploss as price can return to fill gap $35.68 at any time. IMO, amateur trader.
EOLS - Uptrend with strong diagonal support lines. EOLS price has completed a large head and shoulders pattern, started a reversal of a small double bottom pattern with 2 very strong diagonal support lines. Big green candle today starts price breakout: $9.97 (06.02.2025). Desired entry price $9.74. Target $10.93/ 12.28/ 12.81. Stop loss $9.15. IMO.
PLTR in Cup and handle pattern, broke out. The price closed on Friday is $131.78 (05.30.2025). Desired entry price $127.88. Target $147.58/ 164.99/ 183.41. Stop loss $119.41. IMO.
Bullish Flag pattern The Bull Flag pattern forecasts in the near future. Currently, it's just early planning with small profits and a reminder to set a stop loss if the pattern cannot breakout upwards. Both the M50 and MACD indicators suggest the potential for price increase. The volume is still low so it cannot break out yet. The price now (Closed on...
GME bullish right now with: - Golden cross in Day frame chart. - Dragongly doji today maybe bullish if the volume higher tomorrow. - MACD bullish . - Pre Golden cross in Week frame chart too. Today (05/15/2025) price closed: $28.63. Entry now, R/R: 3.34. Price target: $34.40. Stop-loss: $26.90. IMO.
With Day frame chart, we have Golden cross and MACD bullish. The price today (05.06.25) closed at $35.52 (up 4.81% with ER fell !!!). The price after hours: $35.39. If entry right now. R/R: 2.91. Price target: $42.52. Stop loss: $32.94. IMO, amateur trader.
- AGL is in a long-term uptrend. - AGL made a golden cross on 04.08.2025 (MA50 & MA200). - The price chart is forming a bowl of patterns. - Price now (05.01.2025): $3.93. - Price target: $7.62. If the bowl pattern fails, cut loss when the intraday price is below $3.66. IMO, amateur trader.
Forecast a break-out up as the price increased by 3.3% in the after hours. - The price area in a falling wedge, almost a descending channel. - The MACD indicator in the Weekly frame shows an uptrend after a rare day of oversold (04.04.2025). The price today (04.30.2025): $108.92. Price target: $135.00. Stop loss: $95.00. IMO, amateur trader.
Bullish Wedge Flag pattern The price broke out on last week and has retested today. In the chart of the week frame, the price is on the MA200 line. The price now (Closed on 04.30.2025): $31.86. Price target: $48.18/ $63.05 IMO, amateur trader.
STT sideway long time then up. Historically, after the MA50 crosses the MA200, the price will move sideways in a band below the MA200 for at least 120 trading days. With chart frame Day. The price now: $81.22 (04.17.2022). Price band: $84.24 - $75.50. If breakout Up, price target: $90.18. If the price closes below $72.81 (04.07.25), this idea fails. IMO.
DOWNTREND The price of XOM has gone too far with the MA200. It will have to return to the MA200 as soon as possible if it does not want to crash. Let's take a look at its price on the WEEK frame. MA50 and MACD support bearish. On the DAY frame, the volume decreased, the price movement was low, the candles were very weak. The possibility of continuing the downtrend...
BAC has completed the correction. Now running on the Uptrend. On chart frame WEEK, the price was crossed MA200 then back up. On chart frame Day, the volume so high and RSI look good. It's mean, the Uptrend started from 04.09.25. In the short term, the price still has to come back to fill at least 1 or 2 gaps that it has just created. Price target: $43.63 Price...
In chart week frame, MA50/ MA200, MACD show downtrend for MA continues. Strong support at $121.02. The pattern head and shoulders not completed so downtrend continues to $121.02 (maybe on middle of June). Now price: $155.52. IMO amateur trader.
Strong support is $25.91. Resistance: $32.30/ $40.32. Uptrend start soon. Price target: $40.32 (09.10.2025). Stoploss $25.86. Price now: $27.75 (04.15.2025) IMO - amateur trader.
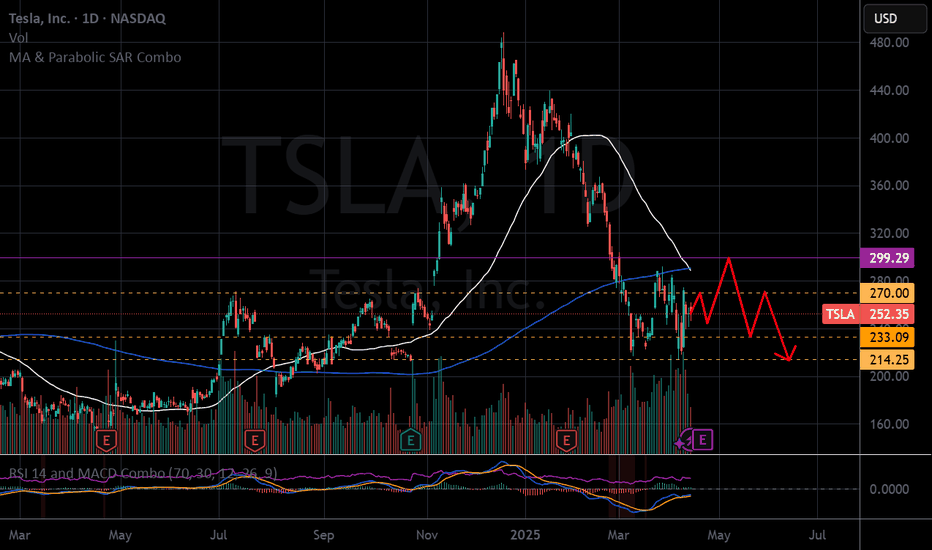
TSLA sideway up a little bit then turn down. Maximum target price this time soon $299.29. Because the volume so high. But in frame Day, MA50 start cross down with MA200. TSLA will in correction. At least will go back to $214.25. IMO amateur trader.
Here is Elliott wave. AMZN in correction wave A-B-C. Price target $201.20 (B). Down across strong support then retest at $188.11. Finish Elliott wave around $145.86 (C), around 08.25.25. Now, AMZN price $182.12 (04.14.2025). IMO amateur trader. Good luck!
Maybe, VZ completed the cup and handle pattern. Now, waiting break out of the resistant at 43.19 one more time, then retest, then uptrend. Target $59.45 Now, $42.92 (04.10.2025). IMO amateur trader.
We have a strong support line. Target $51.39 (02.2026). Gain 35% from now (04.10.25, $37.78). ----- Dividend 3.92%. IMO (Amateur trader).


