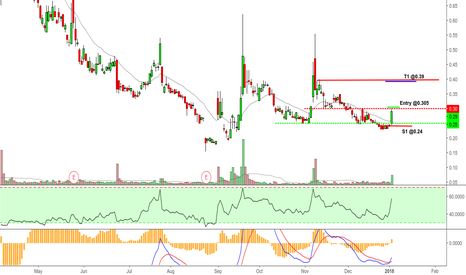
Score = 10/12 1) Structure- Price at previous high support, fib support. / 2) Trend- Uptrend. / 3) Strength & Weakness- No sign of strength on bears. / 4) Future Trend Setup- Breakout up to 0.01. / 5) Indicators- i) RSI- 62 Uptrend. / ii) 20EMA- Uptrend, price above. / iii) MACD Lines- Uptrend, >0. / iv) Histogram- Sideway, >0. X 6) VSA- Volume ) Less volume...
1) Structure- Price at all-time low. 2) Trend- TTF downtrend, LTF downtrend. 3) Strength & Weakness- TTF strong selling, LTF weak selling. 4) Future Trend Setup- Bullish up to 4.63 RSS. 5) Indicators- TTF: i) RSI- 32 Converge sideway. ii) KC- Lower Channel down. iii) 20EMA- Down, Price lower. ...
Condition: 1. If price gaps up high at pre-market or market open, I will cancel the orders and wait for a gap up pullback on 1min/5min timeframe with good R:R ratio to get in again. 2. If my entry is triggered with weakness or potential trapped, I will watch the move for the next 30min and get out of the trade if strong selling occurs. Hold the S1 position if...
1) Structure- Price at SPP. 2) Trend- TTF downtrend, LTF downtrend. 3) Strength & Weakness- TTF weak selling, LTF strong buying & weak selling. 4) Future Trend Setup- Bullish up to 9.64 RSS. 5) Indicators- TTF: i) RSI- 40 Converge sideway. ii) KC- Lower Channel down. iii) 20EMA- Down, Price lower. ...
# Price marked up from previous low breakdown failure(less volume are interested to the breakdown). # Mark up is supported by volume spike showing interest. # RSI higher high. MACD lines up below 0, histogram converge. # News: Restructuring plan. Condition: 1. If price gaps up high at pre-market or market open, I will cancel the orders and wait for a gap up...
1. Fundamental = Buy. 2. Technical = Buy. 3. News/Rumors = Buy.
At 145.28 resistance zone, seems like a Wave 2 retracement. Waiting for bullish candle/pennant breakout for Wave 3 confirmation, or resistance zone accumulation for a BUY.
Good fundamental. At 145.28 resistance zone, seems like a Wave 2 retracement. Waiting for bullish candle/pennant breakout for Wave 3 confirmation, or resistance zone accumulation for a BUY.
At a resistance zone, waiting for accumulation or a bullish candle into Wave 3 move to BUY. If breakdown resistance 71.33 will continue the move to the lower resistance zone 68.00.
Wave 4 retracement with Pennant. 100/200 MA crossed bullish. Price near 100MA support. Waiting pennant breakout to ride on Wave 5 bullish.
Huge volume and a gap up from support. Low bollinger band. Good bullish trade before earning season.
T breakthrough 200 MA. Will see some pullback to 39.64 and back down to 37.78. Checkout for EARNING ANNC.
T trades down toward 37.78 strong support and breakthrough 200 MA. Will see some pullback to 39.64 and back down to 47.78. Checkout for EARNING ANNC.
Daily uptrend near 6.00 support. Pennant on hourly. Touch 50MA. Wait for a bounce off support, hourly pennant breakout, bullish candle and higher volume to BUY.
MAs shows sideway direction. Pennant pattern formed near 204.03 support. Wait for pennant breakout or a bounce from support to be bullish.
Might have reach support and bounce from 130.98. Waiting for a retest for a BUY. If breakdown 130.98 support will be more to a SELL.
Near strong support. Waiting for bullish candle and a retest with great volume to buy.
WMT seems like a great potential to break it's accumulation and to 100MA. Maybe it is a great long term investment to BUY?


