has1988
Planning some setups for tomorrow. Green zone are Zones where I search for entry long/close short. Red the other way around. Made an elliot count. Made it more for fun. This count is bearish since I counted the turquoise W5. Anyway there are alternativ countings, everytime. Feel free to post your countings here. would be happy to see some. Trend ends when it ends...
Can be used on every timeframe but I prefer 1Minute to 1Hour candles, 1Day-timeframe triggers are not very often. Example pictures are from the 1hour chart. Trading divergences allows to set tight stops. But trading divergences is also trading countertrend most of the time. parallel channel enhances the win/loss-trades ratio and still enters fast enough to don´t...
Buying the rebound of ECB-News Support and Trendline around this area atm On the first sign of strength on 1 minute chart i will go in long
So there are a few opportunities. Let´s start with Entry 1. 1: The buy orders of peoples set to the white trendline-break upwards will trigger the Stops of the guys that gone short on yellow Doji ( stops are just above the Doji). A fast upwards move would be the effect. Target would be around 1.187. There is a 1.272/1618 Fib-confluence (Butterfly). 2: A triangle...
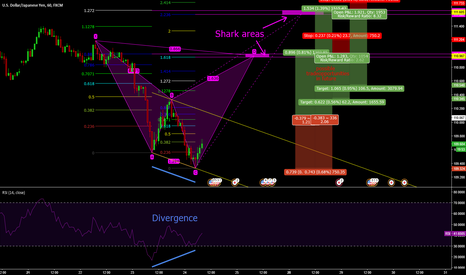
Harmonic Shark Pattern Possible. Even 2 Types there is an area of confluence between 0.882 /1.618 and 1.272 / 2.236. Both Combinations are Shark. There is a strong bullish Divergence between price and RSI (blue line). But to Trade the D-Leg before Pattern is formed I wait for a break of the yellow parallel channel. That would indicate that the bullish momentum...
After a bullish Trend on Daily we are now in correction. So we are bearish in 4hour chart. I think it´s Daily C Wave that just started after a double ZigZag
Since i had some consecutive losses in my last Cypher trades I didn´t entered at 1.272 projection. Just entering if price clusters with time and setting half of positions stop tight (over X). See below for bigger picture
Butterfly pattern is forming, or maybe already formed? Realy hard to say. So i set up the white stopbuy for the case that it´s already triggered and looking forward reaching Target 2 of butterfly ( C to D *1.272 => around 15.4$) purple W4 overlapped with W1. Nothing special in an Wave5.5.5. Also closingprices didn´t overlap until now and it could be just...
On higher Timeframe I think we are at the beginning of trendchange from bearish to bullish (look at comments). So I am watching out for getting into it early. There are to possible elliot wave counts in my mind ( purple and turquoise). Anyway both of them allow me to go Long atm. using Stopbuy.
The candlestick pattern resembles shooting/evening star. Stop below 0.382
I am already in at 0.72657 but wanted to share this beautiful pattern
W3 was very extended. trend was exhausted so W5 formed doubletop
Cypher Pattern inside of parallel channel. I set some Stopbuy-orders, will buy if last recent low don´t act as resistance. I will adjust buystops if something new happens
potential Cyphers and butterflys the last wave( C of AB=CD is an ending diagonal with overlapon 1 min timeframe)
I will just start the trade if Price and Time is more or less correct. A Trend reversal Pattern like Butterfly and 5-0 on lower timeframe between 12:00 and 23:00 UTC and 1.4142 and 1.4154 would be perfect. But also some SellLimits are ok cos the Trade is a PriceTimeTrade. if Price hits 1.4162 in the afternoon for example, it´s not Clustering anymore and the...
W5 with overtrough ETA = Estimated Time of Arrival EPA = Estimated Price at Arrival


