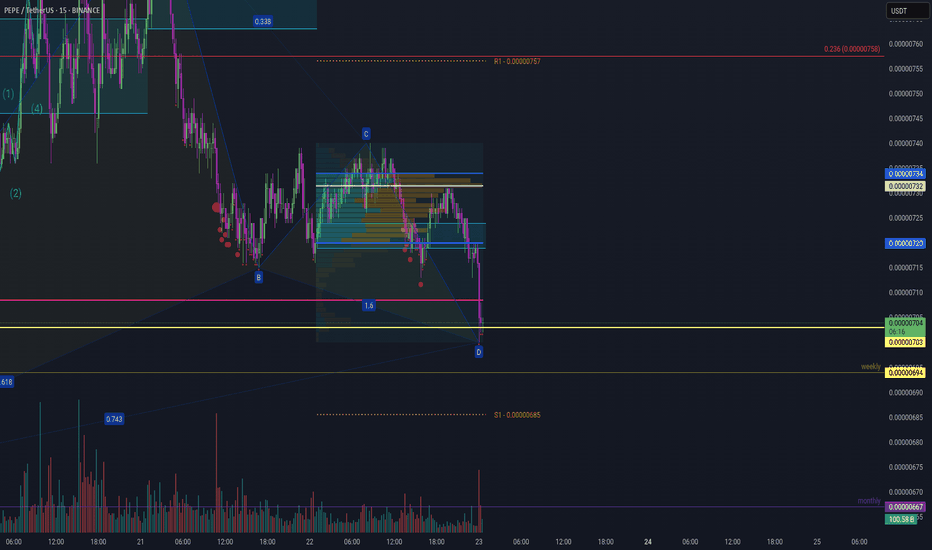
Fib retracement low high low previous vs now. Descending triangle, maybe a fakeout on the 1.618, technically looking good for a swing up. Just an idea but trend looks good for the upside in my opinion
Example on example: One to keep an eye on is that 1st one on the left - Ascending. Why at the moment it's not a threat? Because the asset has put in a higher high. (What I think). The current trend is, higher high, higher low higher high, higher low. Seems that's being protected. So, interesting! I think if we loose this market structure, well at least I...
Here mini range .. Elliot 12345 perfect 1:1 extension drawn from 1 to 2 to 3 .. (MAX) 1.272 .. before upward momentum. My technical! Dump before a pump :)
Good luck seeing this level again :) This is my kiss you goodbye level. I've had this level drawn for some time now and it's been so well respected! This contradicts my Eliot Wave theory being the 4th wave but this level is awesome! Maybe emotional but, this level is key! Lose it then yes probably more downside. As long as were above, were kicking ass! To...
Lets have some fun! Ok, A B C - Fib channel pulled from A to B to C. Flat parallel channel pulled from the obvious range high to low. Dotted white line 0.5 (mid way). Standard fibs: 0.383 to 0.618 resistance. Look back. -> What was resistance now will = support and visa versa. And Current 0.236 seems we've broken out and up so taking it as breaking a...
Trying to keep this clean and not had much time to study the theory exactly! What's drawing me to this pattern the most is the trend lines (brown/orange) IF, 1,2,3,4,5 (Blue)and we've hit wave 5 already. We're very much in the corrective phase (Green). B to C I've drawn the fib highest high to the lowest low (This is trading logic, not sure this is how waves...
Please see fibs based from low to high gives you 0.618 at the ATR S1. Gartley can retrace up to 0.382 to 0.618. Best case drawn to 0.888 a daily at that level, to retrace back down to 0.782. Very rough analysis based on a post. Given the current Fixed Range Volume looks broken (:D) I'm taking this approach. Have to say, Chart Champions - Daniel. Not...
I'll probably get told of for a lack of detail here. But this my friends, is a deadly bullish combo. Already bounced of 0.618, and coming back for the 0.618 on a POC for confluence. I'm not guaranteeing this is bullish, BUT watch for the reaction of the 0.618 again! If we get a good reaction. Super bullish to cover my previous chart resistance levels. Have to...
Using indicator - Market Order Bubbles by Laviathan Firstly awesome indicator! Love it for guaging high volume buying and selling (used for panic selling or panic buying). The higher the volume the selling the bigger the red bubbles. Inversely, greedy buying, bigger green bubbles. Sometimes, the bubbles are genuine, as literally big sell offs or strong buys....
Eliiot Wave Update Firstly, I'm bias that I believe were in Wave 4. Depicted wave count 1 2 3 4 5 in orange may very well be as it is, in that the last low is 5. My bias comes in because from what I've read, 5th wave usually 1.27 fib extension drawn from 1 to 1 to 2. As can be seen, 1.272 is at 0.0000336. The green paralellel channel from the high to the next...
Bullish Gartley continuation uptrend from previous uptrend. Gartley drawn loking for continuation to the upside with Anchored VWAP and fibs. Anchored VWAP in white (Amen =))) .. previous trend here:
Trend based fibs pulled from A B C - in red left. This is not the full picture, work with me BUT still levels. The downtrend is a 1-1 extension from high to low. There is a caveat. I'll explain over the weekend. Basically the next level down is 1.618 at 0.0000464 Fib 1.0 current resistance. Explain more over the weekend. We have time.
Flipped Resistance to Support from previous Trend Based Fib Extenstion as seen here: Currently bouncing off the 1.0 fib which to left was a support, middle resistance, now support! Taken the value area range of the initial Trend Based Fib to the current price and if you zoom out, the PoC of the Fixed Range Volume Profile is pointing to 0.5 Trend Based Fib....
Fistly, the only harmonis I can find that extends so far on C or D is shark harmonic. Not sure if these are actually valid however, I'm finding them useful to guage on fib retracements at very least! Internal Gartley in Red - Target A - Mediumm term External Gartley in Blue - Target D (Best case) at 1.618. Taking us to those evil 3 peaks! Given these...
Hi guys, just thought to post my ideas for a setup. Bullish Gartley at S2 retracement (RED) Bearish Gartley at S1 retracement (BLUE) Wait for confirmations - don't rush into any trades.
Get in now guys, Selling pressure ... but in now. Get in .. Doit!
PEPE / USDT - Elliot Wave Update Topic: Hit end of Wave 3 into 4 Left chart Macro Elliot Wave: -------------------------------------- Pepe Elliott Wave 0-1-2-3-4-5 showing that (i believe) we've ended Wave 3 and probably in Wave 4. The 1.27 is an extension of 1 to 2 (debatable if that's correct). End here is 3 to 4. 3 We've hit (I believe) 4 needs to be...


