hodkar
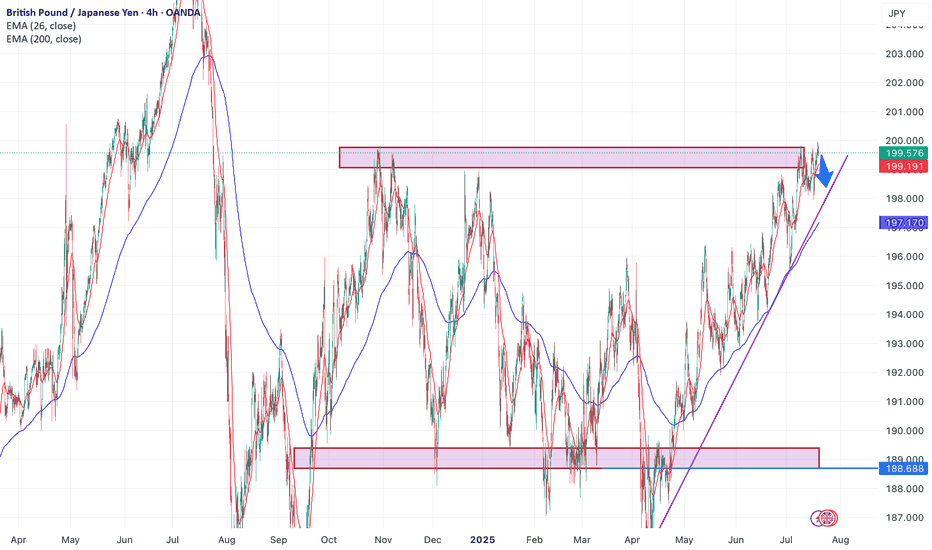
I have analysis for shorting this pair. Let's break down my reasons and see if we can confirm them: 1. **Broken Trendline**: the blue trendline has been broken and that the price attempted to retrace back to it. A broken trendline can indicate a shift in market sentiment. If the price indeed retraces to the trendline and shows signs of rejection (like forming a...
In the current chart, we are observing a range-bound trading pattern, with the price nearing the upper boundary, which is also a significant psychological level (200) . In the other hand a double top formation has emerged in this area, indicating strong resistance, as the price has previously touched this level multiple times. As we approach this critical...
I plan to sell from static line until 196.50 and then consider buying once the price reaches the trend line marked in purple. Before making any buying decisions, i suggest that a short position might be warranted.
"As you can see, we are in a downward trend between two blue lines. Currently, we are at the top of this trend. It seems to be the right time to sell, as the static pink area intersects with the blue trend line. Therefore, it’s time to short. We can expect to reach the first take profit (TP) when we touch the minor uptrend indicated by the purple line."
According to the chart, we can see that the trend is upward, and we should wait until the price reaches the trendline before buying. It is important to set a stop below the blue line, which represents the 200 EMA."


