hoiyanxo
My view on the daily time frame for DXY - overall bullish to go with the weekly analysis. We've had 4 BOS to the upside on the substructure and currently in the pullback phase and has reacted to the extreme of the demand zone on daily time frame, so we could potentially see the shift into bullishness on the LTF
Notes on the chart. Ideas/opinions would be very much appreciated as I am new to this so any feedback will be taken into consideration!
My thoughts on GU. Notes on the chart. Ideas/opinions would be very much appreciated as I am new to this so any feedback will be taken into consideration!
Current view on GU. Notes are on the chart. What do you think? Ideas/opinions would be very much appreciated as I am new to this so any feedback will be taken into consideration!
All of yesterday, GU was in an impulse phase and towards the end of the day, a bearish flag formed, indicating bearish pattern. Entered 2 positions and target of 1.37000 which is a 1:3 and 1:6 RR. Ideas/opinions would be very much appreciated as I am new to this so any feedback will be taken into consideration!
Zoomed out so you could see the overall structure. On the 4 hour time frame, it shows a downward channel, indicating higher prices. Price broke out of that channel on 21/1/21 and has now recently retested that outer channel. Price formed corrective structure and has recently broken out of that too so I entered there. I entered at 1.21448 and 1.21435, I feel...
The two positions I entered as it broke the downtrend trendline on the 15 min time frame and started to form a bullish flag continuation pattern. I feel like I entered a bit too early as I could have waited at the bottom of the flag to catch more pips, nonetheless it also broke above previous structure for continuation upwards. Looking to enter another position if...
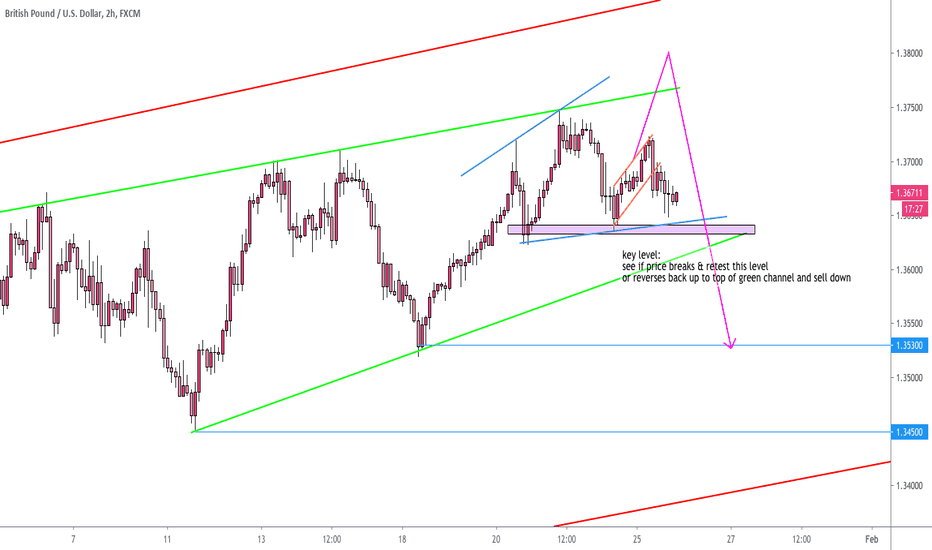
Price didn't really move much today. Looks like it's in a consolidation. Key level (1.36400) is marked for a break and retest to the downside or if price rejects and goes back up to the top of the green channel (4 hour). Areas of TP are 1.35300 and 1.34500. Would be ideal for price to move back up before coming back down for a higher probability trade....
On the daily time frame, it has been in a downward channel (red) On the 4 hour time frame, recent price action shows a bullish flag, which is a downward continuation pattern. I believe that price will go to the lows of the channel (1700) before moving it's way up to the top of the outer channel and go above. Ideas/opinions would be very much appreciated as I am...
Descending outer channel (red) formed from the daily time frame. Long term uptrend would target 1.34000, otherwise target previous structural highs. Price failed to make a LL before making HHs and HLs. Indecision candle and wick rejections formed at the green trendline before strong bullish momentum to the upside with minimal pullbacks. Wick rejection forming at...
Daily outer channel (red) Ascending triangle forming on 4 hour (orange) Resistance 142.200 Could form a breakout to the upside and target outer daily channel. Or could form a fakeout and catch people on the wrong side of the market before selling all the way down - as it is an ascending channel. Will wait to see what happens at 142.200. Ideas/opinions would...
On the daily time frame, the outer channel (red) is plotted. On the 4 hour, the inner channel (green) is plotted. Price has now broken out of the green channel and coming back to retest the key level and previous resistance 1.37000 which price failed to break before in the past. However, it broke above the other day which could have indicated a buy bias and get...
On the 4 hour time frame, it shows a downward channel and price has broken out of the channel and starting to retest a key level. If price shows wick rejections and bullish sentiment, I would be buy bias. 3 different targets are plotted at 1.60000, 1.61500 and 1.62500 with a SL of 38 pips below structure. However, 1.62500 would be for longer term. A minimum total...
On 1 hour time frame, it has shown a downward channel and has broken above and maybe looking to retest 1.21500 before moving up and aiming for the top of the channel. At the structure, would be looking for wick rejections, bullish candle close. SL would be under the structure 1.21500. 1:14 RR However, my GBPUSD analysis shows a sell bias and EURUSD & GBPUSD are...


