imkeshav
PremiumI first tweeted this fractal at end of September What happened then in 2017 and now 1) We make a temp top (Top1) and drop 60% in price - DONE 2) We make a double top (first red arrow) - DONE Next predicted as per fractal 4) Support from 21WMA (green arrow) - DONE 5) RSI taking support from blue line - DONE 6) RSI following our red squiggly path -...
The drop looks like 5 waves, assuming its the first leg of a larger ABC. So expecting a 3-wave B wave bounce to 0.5Fib to 0.618Fib (blue box) Reasons for assuming 5 waves 1) Wave2 deep while wave is sideways and shallow 2) Wave4 rejected at channel bottom Assuming 5th wave done with the bullish divergence on the RSI (blue line) Next steps: The move to 43k+...
A bull run is sustained as long as price holds above 200DMA (Daily moving average), but its retested (blue arrows) as in earlier runs. However, we NEVER had a weekly close candle below the 200DMA and the bull run continuing again. As shown by the hammers in the chart, a weekly candle close below the 200DMA line in 2014, 2018, 2019, 2020 marked the end of a bull...
I'm considering the entire move as a red ABC where C = 1.23x of A What we saw is an extended blue 5th wave having another extended 5th subwave within which had a 100% move Expecting a drop to 21WMA or 0.382Fib/0.5Fib RSI also losing steam
The bounce looks corrective and confined to the channel, assuming its a (B) wave for now. The drop is looking impulsive now Considering this as 1st leg of the (C) wave Expecting $6 as target
The chart should be clear enough S/R = Support / Resistance WMA = Weekly Moving Average
The entire move looks corrective and bounced till 0.618Fib, so unless we breakout of the channel, I expect a move down For now assuming the drop to be a C wave
At a first glance, this entire move looks like an ABC where A= C. The price also rejected hard from the red resistance zone, if the current support level is lost (this is the confirmation for this idea) , I expect the correction till below 2 targets RSI weekly was heavily oversold and if it breaks blue channel, expect a sell of Take care
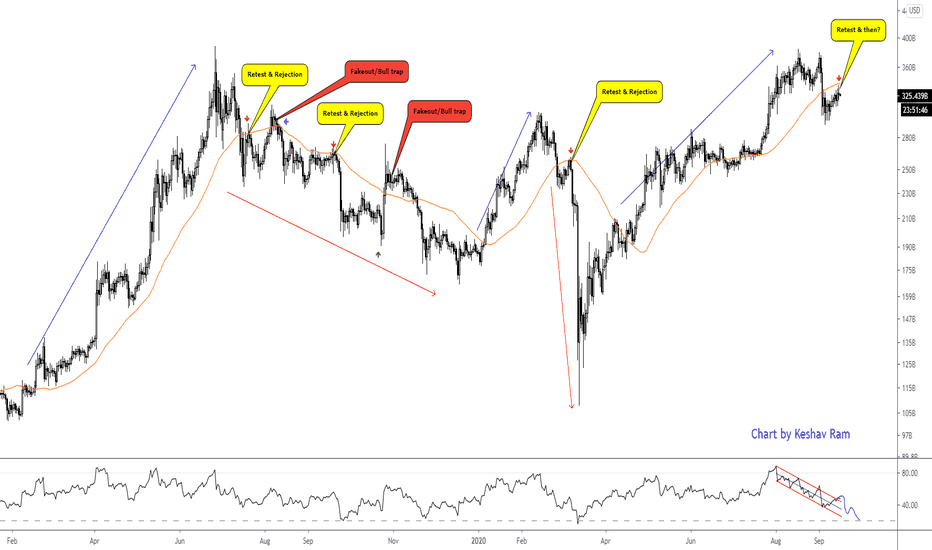
Analysis: In an uptrend, index needs to be over 50DMA (orange) In 2019 rally, 50DMA was not retested In March, 2020 rally, 50DMA was briefly lost In a downtrend, index will drop below, retest and get rejected from 50DMA 50DMA lost in July 2019, retested 2 times in July and August 50DMA lost and retest failed in March 2020 crash Index needs to drop below 200DMA...
We are in a S/R range now and waiting for a confirmation of breakout or breakdown will give a sense of direction. But gap is huge for the next level. So take care All the best
- Rejection from 0.618 + Resistance cluster above $440 - 0.5Fib failed to as support and now flipped to resistance - Expect drop to 21WMA + S/R support - losing above 21WMA support then target eventually drop to Green support cluster Bias change if 0.5Fib line ($360) becomes support
We are seeing rejection at 0.618 Fib + Horizontal resistance for multiple weeks, expect a drop to next support at blue line and if that doesn't hold, the next support is green line
The bounce from the lows looks like a (B) wave of a larger FLAT correction, also seeing 1:1 of the internal sub-waves and confined to a channel. The (C) wave can play down as an impulsive 5 waves Confirmation: We need to go below 50WMA just below 11,000 Target 1: 8500 (C is 0.618x of A) Target 2: 7000 (C = A) From fundamentals perspective, India had the worst...
This 3rd attempt to breakout from the downtrend red channel is rejected again, also confluence of 0.618Fib resistance Expect a move to 50WMA and losing that to channel median line RSI lost support as well
In an uptrend, the corrections drop to take support (red arrows) at prev consolidations (green boxes) and then resumes the trend. Now, after 3 successful supports, the current consolidation has failed to support the drop in price and likely will now offer resistance This could be a sign of trend reversing and logical move would be to drop to the next green...
The idea is simple, above 200DMA you expect a rally and below it a correction, previous instances are circled in blue. Even if you are chopped up by sideways movement, eventually you will catch the big trend move Also considering the sideways consolidation, I consider price staying above median line will take it to channel top, so now we are seeing resistance at...
Considering that we are possibly done with 5 waves, the drop is assumed to be an ABC and it also forms a Head and Shoulder pattern whose minimum target is $307 Invalidation: $410 (B top) Confirmation: Below $375 Target 1 : $335 - 0.382Fib + A=C Target 2: $310 - 0.5Fib + HnS target + C = 1.618x of A All the best


