Yes, the knife is falling and I am trying to catch it so don't try this at home. Started a position at $83.90. I'll double the position if/when it hits that lower trend line in the area I circled around $70 or so. If that line holds I'll be looking for at least a 2 legged pullback to $110-120 and at most a run up to $145. Under $65 and I'm taking the loss.
I hate trading these weak and drifty channels. If it were a stronger recent move up I'd be looking at the 618 fib extension at about 4100 as my target. Nevertheless, it's looking for a 2nd measured leg up, which would conclude at about 3900 or so. Provided it doesn't pull back below 3510, I think it will keep drifting its way to the 50 fib ext. I'll also be...
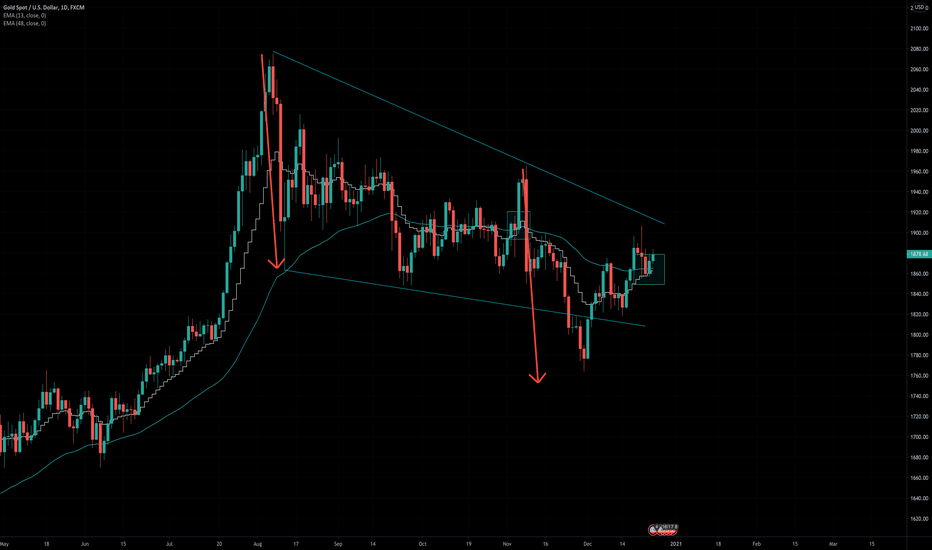
Aside from a possible bull flag and the completion of 2 corrective measured moves down, the 13 EMA is about to attempt to cross over the 48 again on the daily. The first real attempt at a cross during this correction was in NOV, which popped but ultimately failed. I've found that the 1st attempt often fails and the 2nd or 3rd attempts often succeed. Good luck!
I expect to trade a move similar to this pre election. Beyond that, it's a wait and see what happens after the dust settles.
Looks like leg 1 in the retrace is complete and we may have started leg 2. With a little more confirmation I'm buying with a target of 1995-2010. SL - 1919
This rising pattern never looked right to me upon breaking out. Now that we have a divergence, my current bias until proven otherwise is the move up to 3284 was a false breakout or an overshoot of the pattern. What I'm looking for next is ES to continue to consolidate inside the pattern as shown before truly breaking out. (note**usually when price overshoots a...
It's there in the title. They've brought me to the promised land, and have also taken raging dumps on my head. I'd love to see it pass a retest of the triangle's upper trend line and continue up to retest the all time highs. But I'm a realist, so I'm also posting what I see as a probable scenario if it fails the upper line retest fails and it goes the other...
Expanding or broadening patterns show up during volatile market conditions. Since the March lows I've had more success day trading these than the more traditional patterns. The current one that began this past Thursday is even steeper than the big baddie that began around February 21st and bottomed out around March 20th. How to read into that near term? ...
(originally posted on ES) Without taking into account much needed pullbacks along the way, the index has gone all Ethan Hunt on a Mission to finish the channel it began building back in November 2019, before a Global Pandemic threatened to destroy it forever. I know, I hear you Shorties. "It's currently wearing out its welcome in a 'bearish' rising wedge...
Without taking into account much needed pullbacks along the way, the index has gone all Ethan Hunt on a Mission to finish the channel it began building back in November 2019, before a Global Pandemic threatened to destroy it forever. I know, I hear you Shorties. "It's currently wearing out its welcome in a 'bearish' rising wedge pattern, and a downward break...
No extensive TA, just noticed the possibility of a mirroring, albeit smaller, descending expanding wedge pattern forming.
We're sitting just below the 300 and 200 MAs on the daily again and coming up against another resistance trend line. If we're in a 3 Drives pattern, which checks out so far, here's an idea for a couple short term set ups.
I avoid shorting ES, but if it becomes this obvious I won't be able to control myself.
No long winded analysis. If it continues down this path, find the best short entry.
Follow up to my post over the weekend. Further support that the ABC corrective wave has become a 5 Wave Impulse. Approx target 3110-3130 (I'm just looking the Elliott rules up online as I go, so if I'm misinterpreting them feel free to call me a jackass)
Last weekend I posted that /ES SPY was in an ABC correction after 5 waves down, and I anticipated that once the correction completed it would resume the dominant trend down in 5 wave fashion to a new low. Makes complete sense and it follows all the Elliott rules. But when has SPY ever really made complete sense? That's why I'm proposing we could completely...
Sometimes the simplest answer is the correct one. If the bear flag breaks, we'll be looking at the 5th wave down. A confluence of major support from 2015 and the lower trend line of an Expanding Triangle that's been developing over the past 3 years is very difficult to ignore as a likely target.
Will we complete the drop from the smaller wedge back down to the lows? Or will we continue to play out the larger? My sense is the larger as the support really held. Ideas, suggestions?


