itsjustanalysis
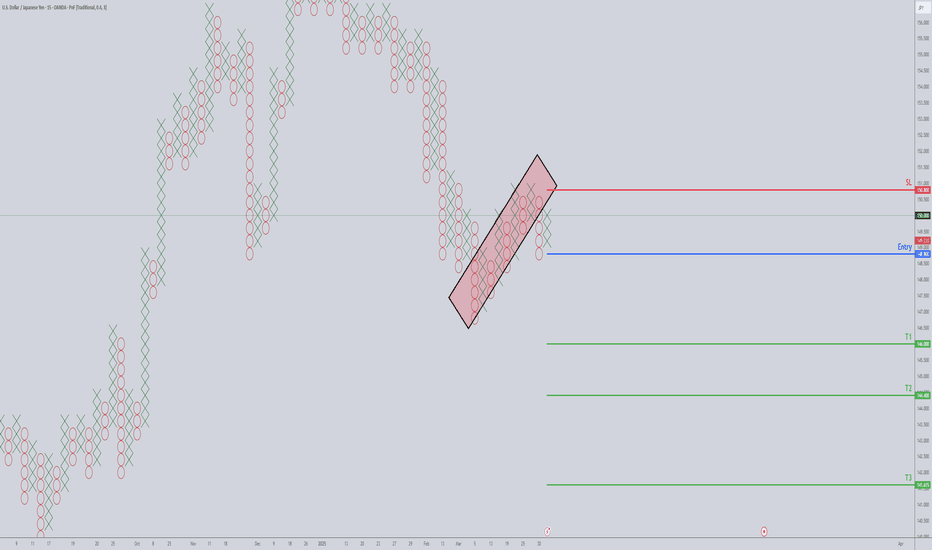
PremiumPoint and Figure charting is the OG technical analysis method—no fancy candlesticks or bar charts needed. Unlike other charts, Point and Figure ignores time and focuses purely on price action, offering clarity amid market noise. If candlestick charts look too chaotic for your taste, Point and Figure usually clears things up. Its simplicity is its best feature:...
Friday, March 28, 2025, marks exactly 144 days since XRP's breakout from November 4, 2024—right on cue with Gann’s "inner year" cycle, signaling a potential trend reversal (or at least a good excuse to tweet "I told you so"). Conveniently enough, March 28 is also exactly 52 days post the "flash crash" on February 3rd (if we're even calling that hiccup a...
It looks like the road to $100 for Injective Protocol is getting stronger and stronger. After bouncing right off the 50% retracement, things finally look good for INJ to make a new expansion move higher.
TSLA Daily Chart 90-Day Cycle (March 15, 2025) – Gann called this the most important cycle of the inner year. Swing highs/lows tend to develop here, with potential culminations at the 90- to 98-day mark. Kumo Twist (March 13, 2025) – High probability of a swing high/low forming around this date. Indicators & Signals: Large gaps between the Tenkan-Sen...
I haven't really posted much on Carney's Harmonic Patterns, but as I was working on some material for The Litepaper, I glanced at dogwifhat's monthly chart and noticed it looked very much like shark pattern - but I wasn't even 80% sure. Had to pull out my notes. Turns out, dogwifhat's monthly candlestick chart is a perfect Bullish Shark Pattern AB = 0.982 of...
The daily Ichimoku chart for Bitcoin doesn't look pretty - but it's not awful either. Resilience is the trait I attribute to Bitcoin here. Even Ethereum, when faced with the same current conditions with the Ichimoku system, failed to hold up and instead toppled. If the structure remains the same, I anticipate another big push higher when both of these two...
There are a series of bullish technical conditions on silver's monthly chart that suggest significant upside potential going into 2024. Those conditions are as follows: An Ideal Bullish Ichimoku Breakout on the monthly chart - if XAGUSD can close at or above $24.56. The DTO returning above the zero line. Hidden bullish divergence between the candlesticks...
Algorand Daily Chart Price Action Analysis ▪ ALGO is very, very close to it's most bullish technical condition since late Feb 2024. ▪ If there's a daily close above $0.13, ▪ and if the Chikou Span remains above the bodies of the candlesticks, ▪ then boom to moon
Zcash's weekly Ichimoku chart is one of the most insanely bullish looking altcoin charts out there I'm nerding out on how insane SEED_DONKEYDAN_MARKET_CAP:ZEC 's weekly chart looks. IF Zcash can close at/above $35.10, it will be the first weekly close above the cloud since December 2020.
🔷 Near-term resistance @ $22.13 🔷 Major resistance between $24.50 - $26.50 (contains the 50% Fib retrace, Kijun-Sen, and bottom of the Cloud). 🔷 Above $31 = moon for #Avalanche
🔷 If it closes in the Cloud, sucky trading conditions over the next 5 to 6 days are likely. 🔷 Major resistance is at $62,700. 🔷 If #bitcoin can close at/above $68,400, there's a high probability of new ATHs occuring soon after.
Reasons why: ⬨ Hidden bullish divergence ⬨ Tenkan-Sen's slope shows strong momentum higher ⬨ Cloud is very thin ⬨ DTO is at support 🎯 2024 Targets: $5,283 & $7,686 Things to look out for as continued bearish warning signs: 👉 The DTO falls below the zero line and remains below for more than four days 👉 There is a daily close below the Kijun-Sen
👉 A weekly close at or above $0.666 would confirm an Ideal Bullish Ichimoku Breakout entry. 🎯 2024 targets: $0.978 & $1.648.
👉 Hidden bullish divergence 👉 Significant support around $154 👉 If bulls can close OMXSTO:XMR at or above $169.16, it will confirm an Ideal Bullish Ichimoku Breakout, the first since May 4, 2024. 🎯 2024 targets: $250.65 & $352.59
⬨ I'm anticipating it consolidating between $31 and $33 ⬨ The Composite Index and Detrended Price Oscillator are both at their respective historical resistance levels
From a time cycle perspective, Dogecoin is currently sitting at the very end of its normal range to retest prior all-time highs. If you consider crypto cycles related to CRYPTOCAP:BTC 's halving, 6 months post halving is generally when we starts to see some big moves in the whole space. From an Elliot Wave perspective, #dogecoin has likely bottomed for this...
Short-term BTC Analysis A pause in #Bitcoin 's move higher? Possibly. Might not last long though. ⚠️ Senkou Span B is the strongest support/resistance in the Ichimoku system, making it rare for prices to break through it. ⚠️ The Chikou Span reacts similarly to support/resistance as current prices. ⚠️ RSI and DTO are at historical resistance levels. Thing To...
Some key things to look out for on #Cardano 's daily chart: ◦ Major gaps between the bodies of the candlesticks and the Tenkan-Sen. The two don't like to be far away from each other, they're like an unhealthy co-dependent couple. ◦ Senkou Span B is the strongest level of support/resistance within the Ichimoku system. ◦ The RSI and DTO are at historical...


