j0niiiperd0m0
EssentialAU is forming a beautiful bearish trend on a 4 hr time frame. AU is also a correlative pair with GA and we see that GA just broke a consolidation zone to the upside giving potential signs of bullish continuation. If AU respects FIB zones, it should continue to the downside to form next lower low. Of course, news will play a role in our bias for now and we will...
Cash rates came out at 4.10% as expected, causing a small retracement on GA. Im still bullish on GA. Its been consolidating in this zone for a couple of days now and to see price break above confirms bullish momentum and a possible push to our next key level. We will wait for price to reject previous resistance level from our consolidation, and for news that align...
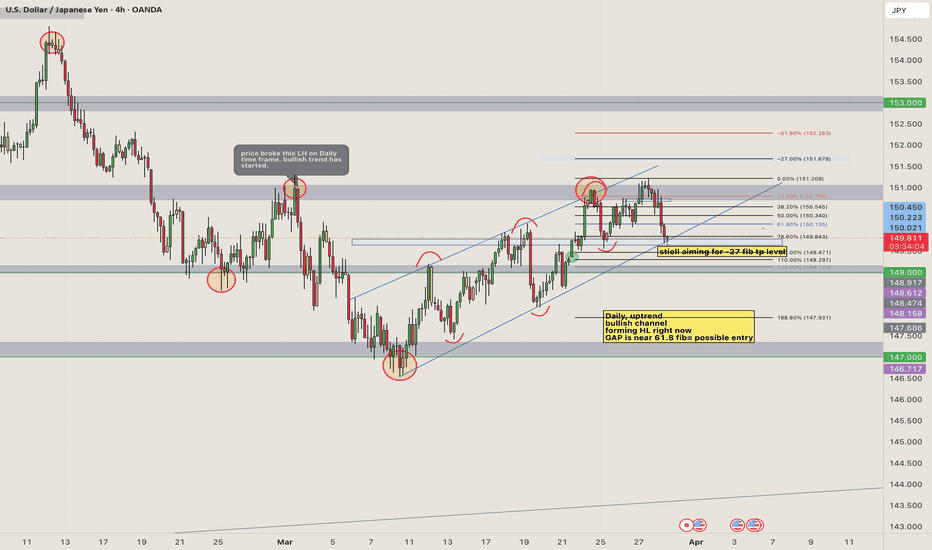
usdjpy has been on a bullish uptrend over the last few days. From a technical standpoint, no market structure has been changed yet for uptrend. On the daily however, downtrend has changed, LH has been broken and Higher high is in the process of being made. price has been respecting my upward channel and im looking for buys with a TP near my -27 area. Will wait for...
gbpjpy is has been giving strong bulish momentum for the past few days. Technical analysis with price action confirms this. Its at a resistance zone right now but if it breaks above, we can potentially see GJ shoot up. News and fundamentals will be our confirmation before taking any buys.
EUROUSD price action is confirming bearish momentum to the downside. if price closes below my key level, chances are itll continue to the down side , atleast to 1.07000 key level. News for USD came out negative and positive this morning with PMI being below 50 (49.8), weakening dollar but Flash service PMI came out positive for the dollar, (54.3) showing more...
gold is on a strong bullish momentum. We will look for buys once it breaks that trendline. it might retrace (very small chance) but my overall bias is bullish. With the tariffs going on, we can potentially see gold go higher. WIll need to wait for fundamentals to align with our technicals before taking any trades.
on a technical perspective, if price closes above the resistance level, it can possibly shoot up to the next resistance level. This is more of a swing trade and we will wait for confirmations before we take sells or buys. overall GA is bullish. will need to wait for fundamentals to align with our technicals
based on technical analysis, EURUSD formed a H&S near a key resisatnce level. Additionally, it borke out of a trendline, finding support in 1.08000 key level. Im looking for price to break that support level before it starts going down. It has to come fill the gaps that it left near the 1.07000 or 1.06000 levels. News will play a role as well. if EUR keeps its...
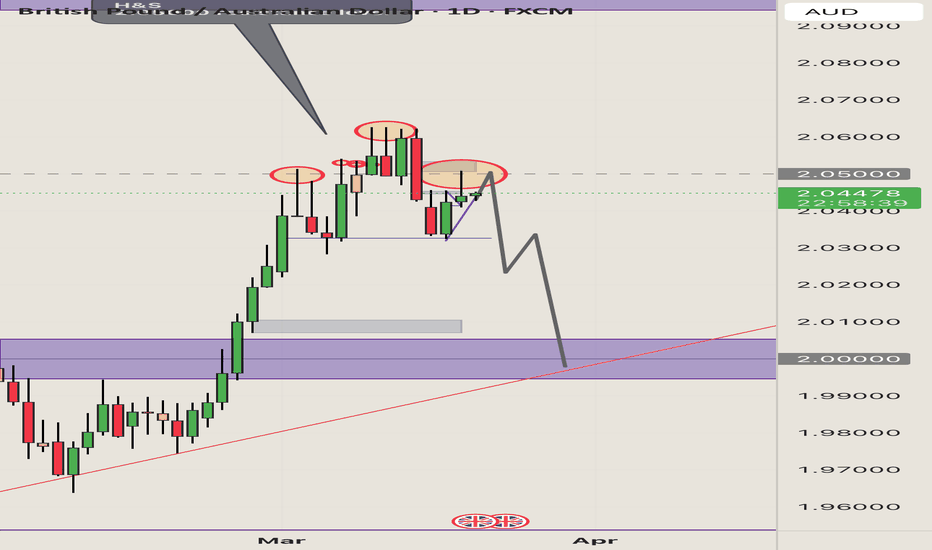
From a technical standpoint, GA is forming a head & shoulders on a resistance level which is a strong indicator of a reversal. Once it breaks below the neck line, sell entries will be confirmed. AU also seems to be bullish, AU is a correlative pair with GA. If AU goes up, GA goes down. News this week will also be a factor in confirming whether or not this bias goes.
On a technical standpoint, UJ is in an overall downtrend. Until it breaks my previous LH, my overall position is shorting UJ. Will have to wait for news this week to confirm sells but we’ll see what happens around these levels.
GU is in an overall uptrend (weekly timeframe ) but on a smaller timeframe, it broke the last HL, giving a potential sign to a temporary bearish movement . I’m looking for price to retrace & drop down to trend line. I still need more technical confluences to confirm bearish movement but so far, it looks like it started. News will also play a role in bearish...
Last week GA showed good possibilities to move to the downside but we were waiting to see what happens with the news considering this week is full of data. Starting out the week, trumps tariffs have now affected foreign countries & affecting their movement. GA is breaking structure to the upside & caused a change of character. There’s now technical indications of...
On a technical standpoint, GJ seems to be struggling to pass that resistance level. It changed market scructure by breaking previous HL & it’s now retracing to 50% fib level. If price respects that level, sells will take place & GJ can possibly go down to 1.90000
From a technical standpoint, my overall position is shorting until it reaches trendline from higher time frame. On 1hr time frame, price action seems to be resisting my 2.0000 zone & bullish movement is decreasing. Market structure us bearish, price reached above 50% fib level, and many other confluences too that confirm a possible bearish move coming up. Because...
GOLD seems to be forming a head & shoulder at a resistance level. Market structure has shifted as well on 4 hr & 1 hr timeframe. Overall I’m still bullish on gold but if it breaks my trendline, I will be looking for shorts.
Market structure is bearish but the trend is bullish on a higher time frame. If GA respects 2.00000 zone, I’m looking for a sell to 1.95. We’ll see what news impact & price action. What do you think? 🤔
My over all analysis is bullish for sp500. On a technical basis, it came out of down trend , & is near my 50% fib Retracement. The overall trend of sp500 has been bullish so I’m seeing sp500 creating all time highs. Fundamental news will confirm entry’s for buys.
Here’s a better photo set up of my sell position. This is only from a technical stand point with multiple confirmations. Fib level, trend line resistance, key zone, EMA cross over….


