jaberhosseiny
GBPUSD had completed the ABC correction. Then it started a new uptrend. We can see possible targets based on fibonacci levels in the chart.
EURNZD has made five waves cycle. After that it had an ABC pattern, now it's continuing a new cycle. So it's falling down till targets I marked.
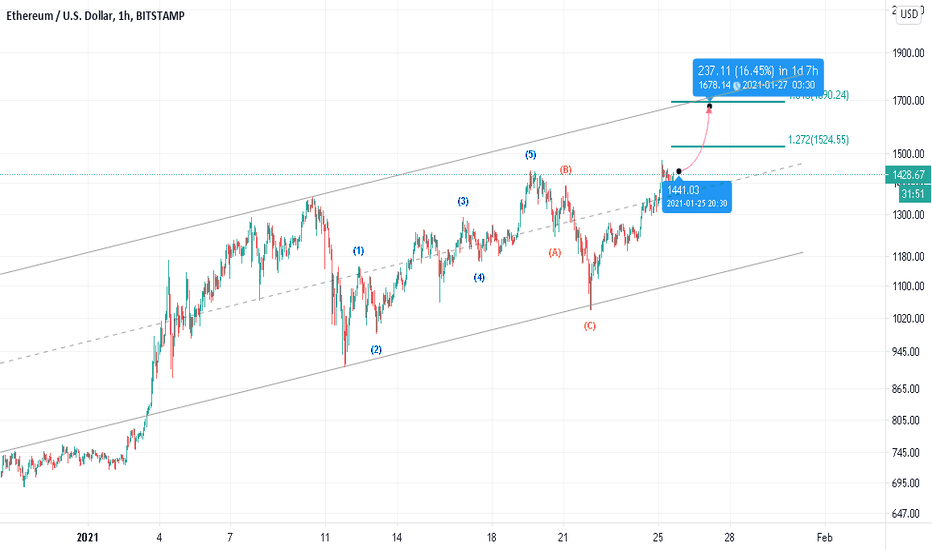
ETHUSD has started a new up trend in the channel after completing ABC correction. Possible targets are shown in the chart based on EXT FIBO RETRACEMENT.
Based on the chart EURUSD (4H) has made an impulsive down trend. Then I except it to make an ABC corrective pattern. It's early to say corrective trend is done, but we can wait it to finish. After that we can setup a short position.
As illustrated in the chart BTCUSD (1H), 5 waves cycle has been finished. Then it made an ABC pattern. Now it's starting a new downtrend in the channel. So it's falling down and can be a good opportunity for short position.
It seems wave 5 is ending in SPX because price is at an important PRZ. In addition we can see a bearish divergence in MACD too. So it can be the end of bullish trend.
As illustrated in the chart ETHUSD has completed its cycle. On the other hand MACD has shown a divergence. So it's starting a correction that can be ended in zones I marked.
As the chart shows there is a triangle pattern after the sharp up trend. The lower trend line has been broken down. So it's falling down.
NZDUSD has made a head and shoulder pattern. As we can see it broke down the neckline. It's pulling back from neck line now. So I think the downtrend will be continued and touch its target.
As you can see in the chart third wave has been done and a counter trend is started (wave 4). C point shows where the wave 4 will be finished. I think it still is early to finish wave 4 and we should wait for now. Then at the end of the correction we can set up a long position in AUDUSD.
Based in my previous prediction EURUSD fell down and It received to a support zone. The question is, will it be rejected by support zone or not? On the other hand I've put 3 EMA indicator (200,100 and 50 period) and Price broke the EMA 200. In addition we can see the EMA 50 crossed down EMA 100, so I think downtrend is still continuing.
USDJPY (1H): After five impulsive wave ,it seems the correction wave is going to be done and we can wait for an up trend. So it can be good opportunity to take a long position. As you can see, I draw fibonacci retracement and projection to find high potential zone to reverse. I'll be glad to know your opinion.
As you can see in the chart, based on Elliot theory the ABC pattern is completing. I expect the current down trend reverse at one of the PRZs I draw. After getting sure about the reversal, we can take a long position. I showed target level by a green rectangle in the chart.
EURCHF (4H chart): In the current cycle 5 impulsive wave have been done. We have a corrective downtrend. 3 PRZ is drawn that are high potential zone to reverse (end of the correction). On the other hand I can see a head and shoulder pattern. If it break down the neck line, head and shoulder pattern will be completed and downtrend will continued till PRZ 3 (number...
5th wave has been completed. Now it is likely making a corrective ABC pattern. The end of correction can be a great opportunity for LONG position.
It's completing the ABC correction. At the end end of correction I'll look for BUY position setup.


