jamestp96
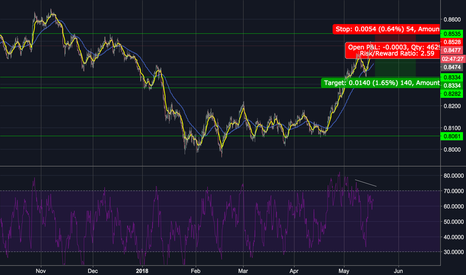
A short position entered at 0.8475. A bearish divergence witnessed on the RSI. Looking for the TP at the support level drawn, potential to drop it lower however. - 0.8334 SL is placed at a resistance level. - 0.8535
A bullish divergence, with a recent bounce from a support level. SL Placed after the current low from the wicks testing the support level and TP is currently at the resistance level. However, shall update upon the trade depending on the movement. Possibility of moving TP further, upto top of the trend line. Slightly risky due to unemployment rate announcement on the 15th.
A hidden bullish divergence is shown upon ETH/USD, unsure about ETH/BTC. Price made a higher low, with the RSI making a lower low. Potential to push up from here. Ideal entry point would have been earlier on, when RSI and price were slightly lower however, I believe this is still a suitable set-up. SL - $636 - this is the most recent low made, past here will be a...
A hidden bullish divergence on the RSI. RSI is currently forming a lower low, just recovered from 'oversold' Price is currently forming what appears a higher low. These indicate a 'hidden bullish divergence' and is a buy signal for me. SL @ the previous low (1.48222). TP @ at the top green line (1.59109), however areas of interest are the other green lines -...
Bullish Divergence occuring, however news within the week for both the US and UK than can impact this greatly. Not placing this trade myself, just an idea and allowing me to view how it would play out.
With a recent higher high on the price, with a rejection from a resistance level and a bearish divergence on the RSI. Believed the bulls are loosing momentum, with a reversal incoming. Expecting a touch of the lower support level, therefore TP is placed here, and a SL of the top of recent high.
Short Term long, bullish divergence on RSI, price lower highs here but RSI higher highs. Slightly risky trade however, SL around 8300, with TP looking for 9000.
No higher highs on the price but higher highs and higher lows on the RSI. SL is placed just below the support level, with TP at the next resistance line. Big questions to ask however, as this can easily be prevented due to any surprise movements that Bitcoin may make.
I dont only ever short, I am bullish, occasionally. Currently following the downtrend evidenced, and seems to touch the top band, then reject it to go on and touch the bottom line. Recently touched the top, rejected and drop, and has climbed just above the mean value in the downtrend. Expecting a sell off again here.
Lower highs on RSI, with double top formation around a resistance area. TP @ resistance level below expected to drop and touch. SL above recent double top wicks, incase it breaks resistance above.
Looking to short XMR around this $233 mark as is a resistance level. Recently broke out of downward 'channel'. Expecting a retrace when nearing the resistance level, to retrace and use the top of the 'channel'(for want of a better term) .
Appears to be forming Bear Flag, 16 days without topping previous day's high. Short position opened, SL slightly above previous days high to provided buffer.


