jbourgault
PremiumHi all, I'm looking to add to my position if price breaks out the latest down trend. Given the current bullish divergence on the OBV, I believe that bears are slowly getting exhauted which could trigger a nice bullrun.
Pretty simple setup here. NEOUSD is standing over previous bearish trend line and pulled back to the 0.618 fib level (all daily candles closed above it). Go time to long for a long term position. However, I'll reevaluate if price goes below the 0.764 level. The white line shows a strong resistance. If price breaks that level, I'll move a stop below it.
Price is now above the previous trend line on the 4h/1d chart and has retraced back to it. It's a good opportunity to try to enter long for a mid-term long trade. Note that the market is still bearish. I'll therefore try to move the stop to breakeven as soon a price reach 7250.
Seems like cryptos we are in a bullish correction. Price has now retraced to the 0.618 fib level. Good time to get in with a timeboxed long position. If price stays below 54 until Thrusday, that would mean that the move is too weak. I would then consider closing the position sooner with small profit. Target: ~57.50 (AB=CD) Stop: 46.90 R/R: ~4.25
USOIL strongly reversed when price touched the 200 SMMA on the weekly chart. A double top is also in place. Excellent time to short USOIL on long term.
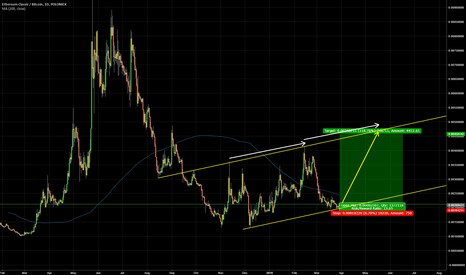
Crypto market in general is definitely in bear mode and that might last if price doesn't move up quickly by strong impulse. That would mean that we're looking down toward a capitulation phase which could last months. That being said, I started looking more at alt vs BTC pairs.- And there are some good signals there. There seems to be a channel forming on ETCBTC....
Price just bounced on the 0.76 fib level and broke upper trend line. I'm going for long now for a very good R/R trade.
Just like most crypto, long opportunities are showing. I'm looking to enter long on XRPUSD on the flag top breakout. Also, strong volume on previous trendline breakout give good strengh to current buy signal.
Could NEOUSD bottomed (and cryptos in general)? We just had a strong bounce on the NEOUSD daily chart at the 0.764 fib retracement level (other pairs are also showing sign of exhaustion). I'll be monitoring for a potential breakout of the current down trend line. Then look to buy on pullback. Why NEO? Because I trully believe in the value of the platform and...
Just like most high cap coins (vs low cap alt coins), NEO follows BTC againts fiat currencies (USD). Support seems to be forming around the 0.764 retracement level on the daily timeframe. On shorter timeframe, we had a potential false bottom breakout today (which could mean downtrend was rejected/bears are exhausted). NEO having so much potential on the long...
Given the violence of the latest crash, I don't believe that cryptos in general are really to trully move back up to ATH. So I'll be looking for short signals on the 4hr timeframe. However based on many major buy signals on the daily timeframe, I believe that the bottom was hit. Therefore I'll manage my stops carefull in case price move back up abruptly. That...
Given the violence of the latest crash, I don't believe that cryptos in general are really to trully move back up to ATH -0.59% . So I'll be looking for short signals on the 4hr timeframe. However based on many major buy signals on the daily timeframe , I believe that the bottom was hit. Therefore I'll manage my stops carefull in case price move back up abruptly....
Hi people, It's been a long time but now considering posting more. I might try to provide early (more risky trade) from now now. I'm looking for a strong reversal on high cap crypto currencies such as bitcoin (especially with lightning network) and ripple. After those are establish, then I'll move capital to altcoins. Just spotted XRPUSD touching the bottom of...
Price just retraced to the 0.764 level. And volume just when up big time with a bullish candle. Seems like the 0.12 level could provide some support for a run to the ATH.
ETH seems on the verge of either go down to previous support, or rally up to ATH and beyond. I'll wait to see if the previous bottom breakout was in fact a false breakout. Then I'll wait for price to breakout north then go long (ref: 1). If price doesn't breakout the top trend line, then I'll go short with a stop over the top trend line (ref: 2).
Price has retraced to the 0.618 fib level which also match with previous lower high. I'll monitor to see if a double top forms at 0.017 then enter short down to 0.0127. Entry: as close to 0.017 as possible Target: 0.0127 Stop: 0.0173
ZECBTC could represent an excellent investment for september. 0.045 level seems like a very strong support zone (bounce multiple times with strong volume). The pair is also oversold. My entry signal will be when the price breaks out from the current channel on the 15 min chart (if price > 0.05). Target TBD. Note that for ZECBTC (and any low volatility pairs),...
Top breakout on this pair on the 60 min chart. Seems like a good time to enter long for a good R/R. Same setup for BCHBTC.


