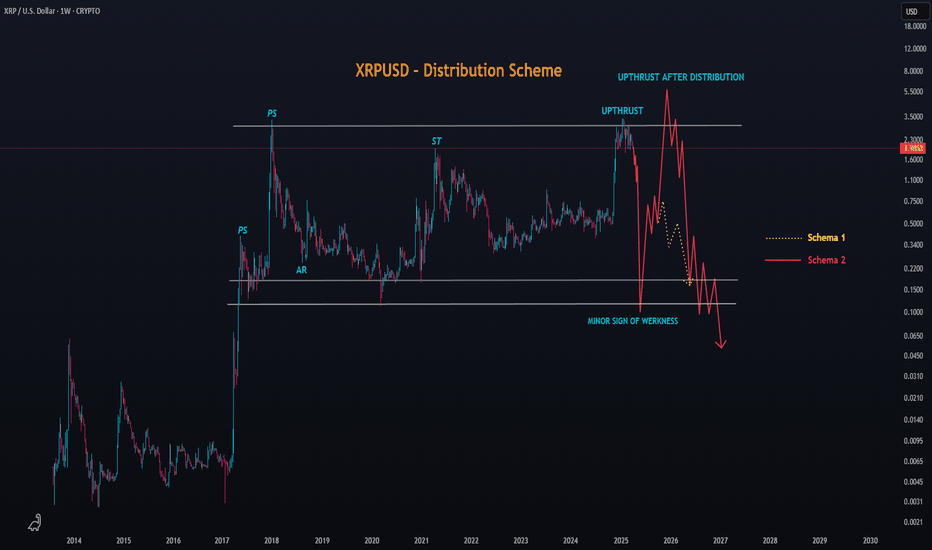
Someone asked me what the most chaotic scenario for XRP's price could be — and I answered: a long-term Distribution phase. In this image, I illustrate a radical distribution scheme that could potentially extend into late 2025. But first, a sign of weakness — with price dropping below the Corona Dump levels, possibly close to $0.10. Sounds absurd to many, I...
Strong institutional money is flowing into gold and precious stones. Historically, this has been a sign of a prolonged bear market in traditional markets. In other words, strong hands have sold stocks at high prices, securing significant profits, and are now moving to the ultimate safe haven: gold, which has been considered a store of value since ancient...
Beef prices are hitting historic highs across the globe, not just in Brazil, as many tend to believe. The surge isn’t isolated to meat alone; rice, chicken, and olive oil prices are following a similar upward trajectory. This global trend highlights an important point: political factors have minimal influence on price movements in this context. Instead, it’s...
Buy the dip in ADA Cardano. Its dominance is in a depressed zone, and we consider this an excellent long-term opportunity. However, it's likely that significant volatility will come our way in the early months of 2025. Buy, just buy, and secure a good average price!
The XRP/BTC ( KRAKEN:XRPBTC ) pair is signaling a potential drop of up to -42% over the coming months, possibly by mid-2025. Historically, we’ve seen that altcoin rallies, like those of XRP, tend to be short and fast, while Bitcoin movements follow a longer and more indecisive pattern. 🔍 Bitcoin Dominance on the Rise At the same time, Bitcoin dominance is...
Starting from the next few months, accumulate as much ADA Cardano as possible and stake it. We are entering the best accumulation phase, which should extend until May 2025. There is still plenty of time to accumulate! In the end, you will have an average price between 0.15 and 0.3 and keep some extra funds for the downturn. BINANCE:ADAUSDT CRYPTOCAP:ADA.D
Now is the moment for AMD to showcase its strength against NVIDIA. Throughout history, market makers have always traded Nvidia first, then AMD. Whether it's product launches at different times or news to change public perception.
Bitcoin's current trajectory hints at a nuanced phenomenon: a complex inverse accumulation pattern. This observation, though not widely acknowledged, carries significant implications for investors. While some may attempt to downplay or overlook these indicators, the meticulous validations suggest otherwise. As we navigate through 2024, there's a growing sentiment...
Bitcoin is testing the bottom of a trend line that has been in place since 2012. So far, it has not been broken above and, for now, serves as the main long-term support.
Theoretically, BNB/BTC is currently in a prolonged upward trend channel, indicating a steady increase in its value over time. Despite this promising trend, there are still 6 months left before it truly stands out in comparison to Bitcoin. This suggests that while the indicators are favorable, the real breakout moment, where BNB/BTC significantly distinguishes...
Analyzing the recurring cycles within the BNB/BTC pairing reveals a promising landscape for strategic trading. Over 650-day intervals, distinct patterns emerge, guiding investors through highs and lows in price dynamics. This cyclic strategy presents a valuable tool for traders seeking optimal moments to exchange between BNB and BTC, potentially maximizing...
After delving into technical analysis in Bitcoin, " Fibonacci Magic Levels " were created. 📉🔬 It is based on the continuity of various Fibonacci levels, ranging from a smaller scale to well-known levels. By precisely calibrating various Fibonacci retracement and extension levels in our Fibonacci Channel, we have identified highly relevant patterns in Bitcoin...
Bitcoin is, without a doubt, an asset that displays one of the most fascinating repetition fractals in the financial world. Since its inception, this cryptocurrency has shown a remarkable ability to predict high and low points in its price, with astonishing precision. This predictive ability is closely linked to its well-defined market cycles. The most...
BTC/EUR vs BTC/USD present significant technical distinctions. Since May 2022, both BTC/EUR and BTC/USD appear to have formed an ascending wedge pattern on a linear scale, which typically breaks downward, signaling a bearish pattern. What's intriguing is that the asymmetry of this pattern for BTC/EUR is more intriguing than for BTC/USD. Over time, BTC/EUR has...
Recently, Ethereum experienced the breakage of its long-term trend channel, which had been maintained since its inception. This channel represented a consistent growth trajectory over the years. The loss of this technical support suggests a significant shift in the cryptocurrency market, with the possibility of an extended adjustment period that could extend until...
Ethereum (ETH) has been the subject of technical analysis in recent times, with some analysts pointing to the possibility that the cryptocurrency may be stuck in a long-term downtrend channel. This downtrend channel resembles a price pattern in which the asset tends to move in a downward trend, with fluctuations within the channel's boundaries. An interesting...


