Both shoulders are nested. Head is a nested double bottom. If this plays out, will probably pull S&P to all-time highs.
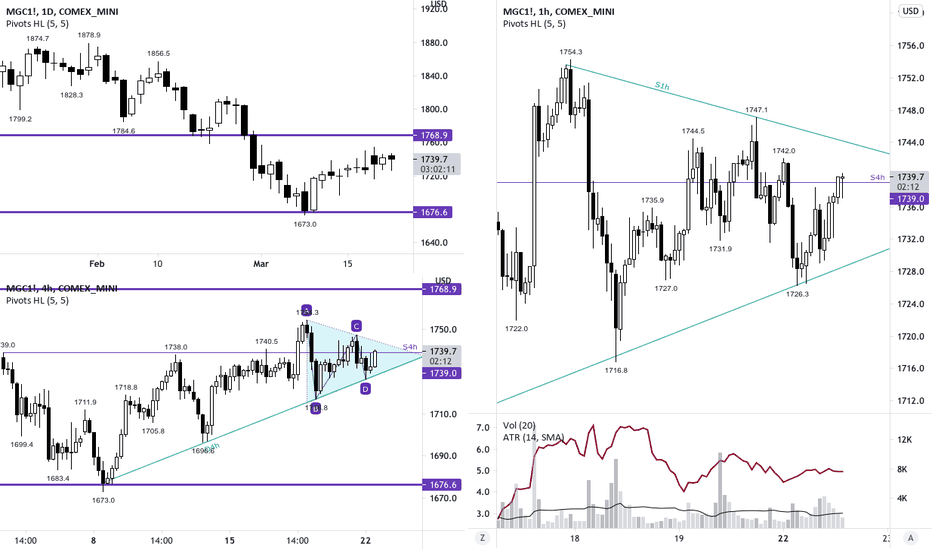
Spotted on 4h chart. Looking for an entry on 1h chart. Volatility contracting (see ATR indicator) as expected. Could break in either direction.
We'll have to wait and see, but if it breaks down, I'll consider entering a short position off of a retest.
Price demand for $BTC appears to be increasing at a linear rate. Lots of trading volume at trendline.
ACB breaking out of wedge consolidation. Lots of supporting volume right below breakout. Stop placed 1 ATR below the signal bar.
Big lack of demand. Dying volume. Increased volume upon breakdown. Fibonacci retracement levels based upon height of 2020 alternative energy rally. 50% pullback is reasonable to see.
See chart for description.
Will AMZN continue upward break of wedge consolidation considering the news?
Another indecisive doji day. Key values to pay attention to for intraday trading are pivot lo from last week at the breakout level and pivot hi from Friday.
Bullish today, closing on hi, increasing the probability that we're seeing a breakout towards even higher highs for the market.
Breakout of recent 320-360 range. Confirmed by above average volume as well as continuing uptrend - close on higher highs.
Morning Star bullish reversal candlestick pattern at EMA200.
Breakout of about 3 months of consolidation and indecision. Breakout confirmed by continuation of uptrend - close on higher highs.
Big bull bar breaking through EMA200 GE has recently established higher lows and higher highs
Reversal @ trendline support Morning Star candlestick pattern trigger
Retesting signal area, currently Retesting @ EMA50, which MSFT has historically had good support @ We saw a similar pattern on MSFT back @ the COVID crash - this is also shown on this chart
Retesting signal neighborhood, currently??


