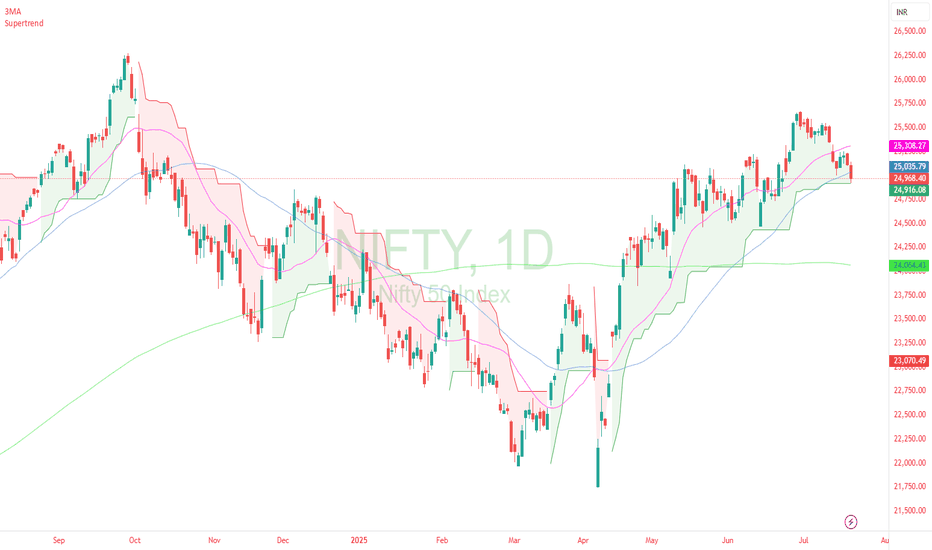
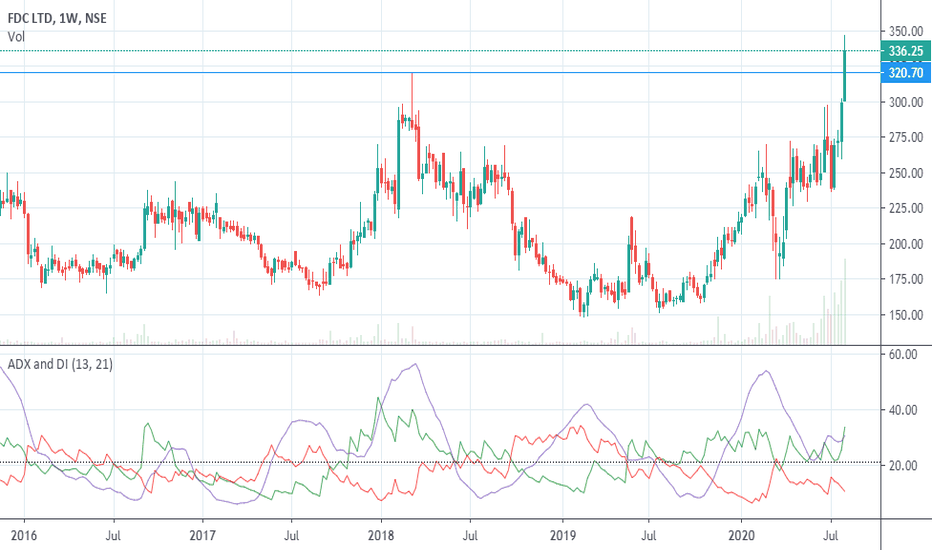
This is great chart . Price is at Supertrend support on daily chart. Lowest risk in going long. Best technical chart in while .
apl apollo has given multimonth break out and stock gone upto 2000. Now stock has done puckback to previous resistance and stock is near ema 21 on weekly chart. This is best low risk high reward entry in good quality company/
vprpl is downward going stock but recently stock has made double bottom and today stock become supertrend positive on daily chart. Next resistance would be 191 and 220. around 220 there is old gap and previous support also. so stock may go consolidation around that level of 220.
NIFTY MOVING IN RANGE SINCE LAST 1 MONTH AND FINALLY CLOSE ABOVE IT AND RE-TEST ALSO DONE. PRICE RANGE IS 269 POINT AND SO WE EXPECT 269 POINT RALLY FROM HERE.
weekly chart..Inverted H & S pattern. Enter after 320 EOD ..First target 424
AFTER CORRECTION UPTO 0.5 RETRACTION OF WAVE 1 RANGE, NOW WAVE 3 IS STARTED AND WAVE 3 TOP WOULD BE AROUND 830
After giving weekly and daily breakout - dr.reddy gives pull-back..opportunity for get in..
ALUFLORIDE WEEKLY CHART SHOWS BREAKOUT AFTER RECTANGLE CONSOLIDATION..
DAILY CHART BREAKOUT IN VINATI WITH ADX MOMENTUM SUPPORT.
CLEAR WEEKLY BREAKOUT IN MONTHLY EOD CHART
Darvas box breakout in daily chart of Aegis logistic


