karamazov06
H&S in formation, volume became very weak (red circles); the last shoulder is describing also a nice bearish flag, so everything seems set to explode soon and we'll see new lows as ETH's value is retesting a historical support from december 2018 (red line), maybe where the green rectangle is located, between 95$ and 81$.
ETHBTC is going to start a huge breackdown as MA crossings, divergence and aroon are all bearish! BTC dominance is also increasing, meaning alts will suffer for now, and so ETH will.
The little jump before the dump didn't occur, but the dump is on its way; there might be a little support @ 114€ and the target stay @ 108€; once there, we'll need to make a further analysis. Check my previous ideas for details and please share your views and analysis for the community ;-) LAST DAYS for BXBC announcement !!!! : BITSDAQ is opening to compete with...
Huge daily triangle was about to breakdown since a long time, and today is the day! Here we can notice a stochastic bearish divergence, bearish aroon is rising but still not so powerful, MFI is neutral; SMA 100 is going above SMAs 8 and 25; next support might be at 0.032700, on the SMA 200. More dump is coming as support in hourly is broken: Please check my...
ETH (and BTC) are still on their way for a sudden little pump and then a first pullback around 105€ (~119$) for ETH. See my previous idea for details and don't forget to check the link below before it's too late (it'll close at the end of this month!) ;-) Announcement: BITSDAQ is opening to compete with BINANCE and they want to make their BXBC token be the next...
We've almost reached 80% of this triangle completion, so a big move is to come. SMA8 is going back below SMA25, both are pointing lower to SMA50 and SMA100. Stochastic is becoming overbought again and continue to diverge in a bearish way, bearish Aroon is waking up and MFI is decreasing.... we'll soon get back in the 100~80$ area and we'll see if the support can...
It seems that BTC is forming a H&S on the daily time frame; it'll be confirmed if it continues to go down and bounces around 6370. Wait and see...
Fractals are sometimes difficult to spot are some of their parts are evolving in shape or length but the most important is to catch the trend; it seems this fractal is still repeating and that is going to be finally the last dump before initiating a bullish trend. Here is the fractal I'm talking about: It looks we have the "M" shape first and the the last...
ETH came back in its previous bearish channel after this surprising short squeeze; but the trend seems to follow back the fractal: this pull back make me strongly believe ETH will dump until it bounces on its main daily channel (black lines). So, why such a dump until this level? Look closer at the BTC/USD chart: BTC maitains its level since 3 days as ETH has...
I didn't see that one coming! I thought it would have been the last moves before the last dump, but it seems another cycle is taking place. Previous moves from BTC chart also tends to confirm we're heading to a strong correction before the moment we're waiting for... ;-)
Here is an updated version of my daily chart; it won't take long before the dump!
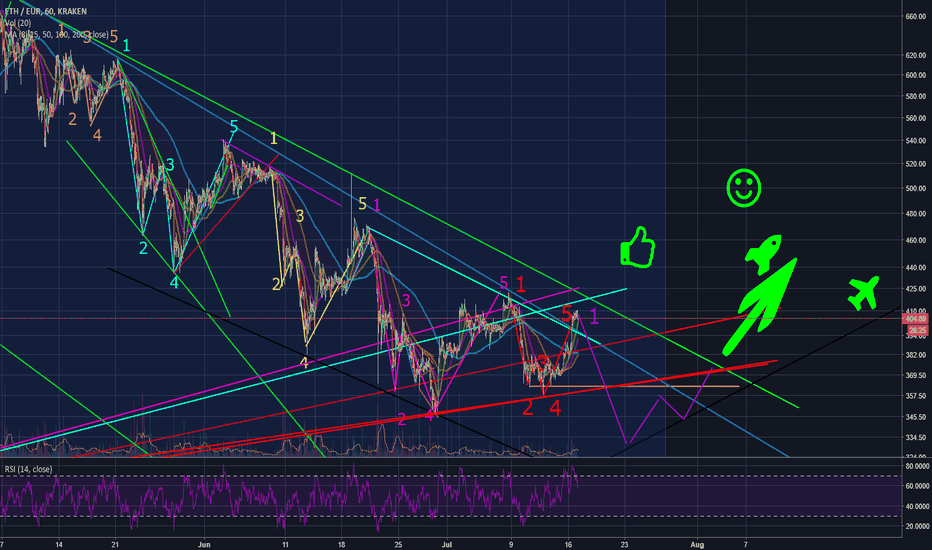
Some pump broke the initial fractal but it seems the direction is still the same :-) So I'd go long from ETH value now @ 370€ to 402€, and then go short to 330€; then finally go long as the bull run we all are waiting for should occur! Until what value do you think the first bull run impulse could go? (don't answer *the moon* please! :-D)
A more detailed view of the fractal wih intermediate zones spotted, dump is still valid
Intermediate rising wedges still keep forming in minutes and the result is a continuous dump. ETH will continue to go deep in the abyss and hitting 370€ and maybe 325€. Soon, the question will be who is giving the trend? ETH or BTC...?
It finally came! but until where !? I think around 370/350€ for a first rebound and maybe deeper as it'll still stay in the main bullish channel... What do you think?
About the last fractal, according to the latest KRAKEN:ETHEUR reactions, I think I did a confusion between the yellow "2" and "4" with the double bottom of the "2"; so I replaced yellow numbers in this new configuration and hope this time it's good! :-)
The fractal includes a double bottom, a pump, and then a big dump. You'll notice that 2 fractals will be on the "6" at the same time, so the support could actually break, and another dump could occur.
The support at 487€ won't be hard to break and it'll go down faster than I previously thought. I don't see any support until 367€, what do you think ?


