7 April FrontKen did strong come back after sharp drop hitting Fibo 0.786. It managed to climb back above EMA50 and 200 FrontKen bounce 45% since BoD on 25 Mar. It shows strong interest amongst the traders. 10 April. First time close below lowest of last 2 candles Confirming evening star reversal and testing EMA200 level FiFT turned RED and Overbought....
INTRODUCTION VIX is the ticker symbol for CBOE Volatility Index, a popular measure of the stock market's expectation of volatility based on S&P 500 index options. It is often referred to as the fear index or fear gauge. When VIX index moving up, it's indicating fear amongs the investor has increased. The probability of market sell off is high when VIX rally. i.e...
JAKS found support around 0.66 Potential Resistance 0.985-1.00 + Accumulation happen around that area with volume spike. = ATOM is back into Neutral territory and MACD turned bullish. + FiFT Buy on Dip signal appears above 0.79 on 1st April with strong BULL force (80Mil volume). - Hit high 0.92 (+16%) but resisted by EMA20 and formed Bearish Piercing candle on...
Many gurus out there urge his follower to BUY JAKS because of GOOD FUNDAMENTAL.. Fundamental Guru call to buy JAKS at 1.18 because they think that it's already at support and under value... Guess what, it drop more than 20% in 5 days after the buy call. BUT Technical Analysis have different view... I use 3 indicators : 1) EMA Indicators with BUY SELL Signal...
Techfast completing cup and handle pattern. gaining momentum to break 0.565-0.575 + Price currently stay above EMA20 and EMA50 and sloping up. + Bull Force remain +ve + MACD turning +ve Standby to Buy above 0.575 Next target 0.66, 0.74
Google rounding bottom target hit 1460-1480. Align to FinWiz price target 1478. Earning Report in 31 Jan. Rally may pause or pullback to form new support. Next plan :- Option1 :- short term trader can take profit. 13% within 2 months.. Not Bad!. Option2 :- Investor/Position Trader. Hold and monitor to add position around trendline or when new support formed.
DAX repeating inverse Head and Shoulder pattern formed in Mar 2015 to Aug 2016. If this is true, 15000 target around Q3/Q4 2020 ?
Gtronic hit TP2. Break 1 month high with convincing volume. Next target 2.6 and 2.8 Hold.
FB Gap down. Supported by Resistance turned Support & Trendlilne @ 206. Plan : Risk Buy and hold if price manage to close above EMA50 Cut if price fail to hold.
Daily chart :- +HSI is way above all key EMA20, EMA50 and EMA200 - BULLISH. +Higher High and Higher Low intact - Uptrend +EMA50 is about to cross above EMA200 - Uptrend. ! BUT Higher Low spotted on momentum indicator - BEARISH DIVERGENCE) ! Dark Cloud Cover formation formed at Channel Resistance. ! HSI move up with weaker volume. Bull is getting weak and...
FB is forming higher high and trying to breakout . Bull force is +ve Add position if price able to close above 200.
Fundamentally strong. Analyst target 312.71 (FinWiz) TA Analysis + Px bounce EMA20 and stay above all key EMAs - Bullish + Fast EMA > Slow EMA - Uptrend + +ve Bull Force and HH and HL Trending Price to break above 294 with volume to ignite rally. Partial Buy 286 Add position above 294. Further buy if break and Retest 294. SL 282 TP1314 (Align to Analyst Target) TP2 328
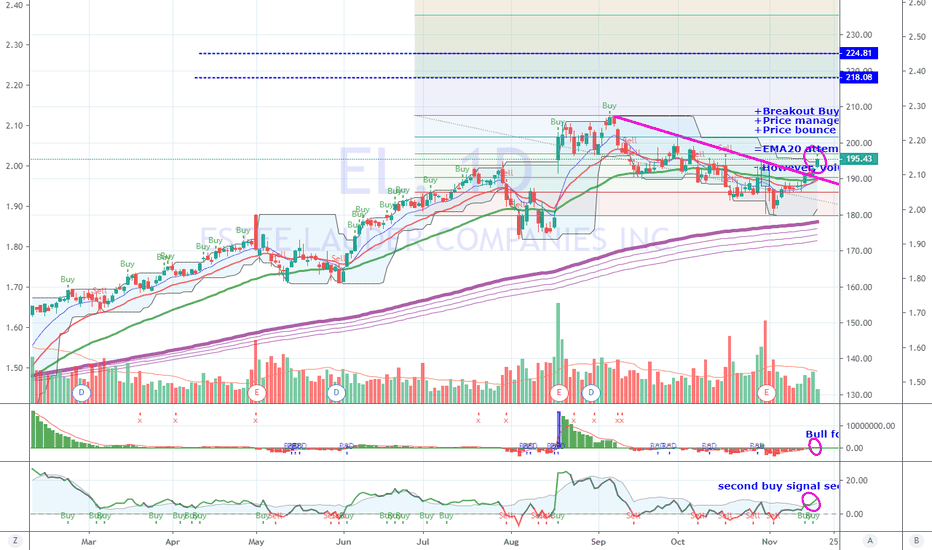
+Breakout Buy +Price managed to close 31 Oct gap down. +Price bounce above EMA20/EMA50 and stay above EMA200 =EMA20 attempting to cross above EMA50 -Bull Force Index turned +ve, however, volume are below average. SL 178 TP1 = 201 TP2 = 207 TP3 = 218 TP4 =224
Strong candle hit Target 194 (Hight 195) Expect to range or pullback before next move. Shift Stop Loss to below 179 Next Target : 210, 240, 260 Accumulate around 189-190 if pullback.
Google breaks and Retest All time high.. Resistance Turned Support at 1280-1300. Plan to Long with SL below 1270 (-30) Next Targe 1400 (+100) , 1460, 1570 Good Risk Reward Ratio
Nicely bounce from key EMAs and Fibo ratio with good above average Volume. Price Up, Volume Up is a nice bull run. Stochastic oversold, +ve Force and price above last 2 high Potential Target : 183, 194 Stop Loss : 160 Risk Reward Ratio 1:1 to 1:2
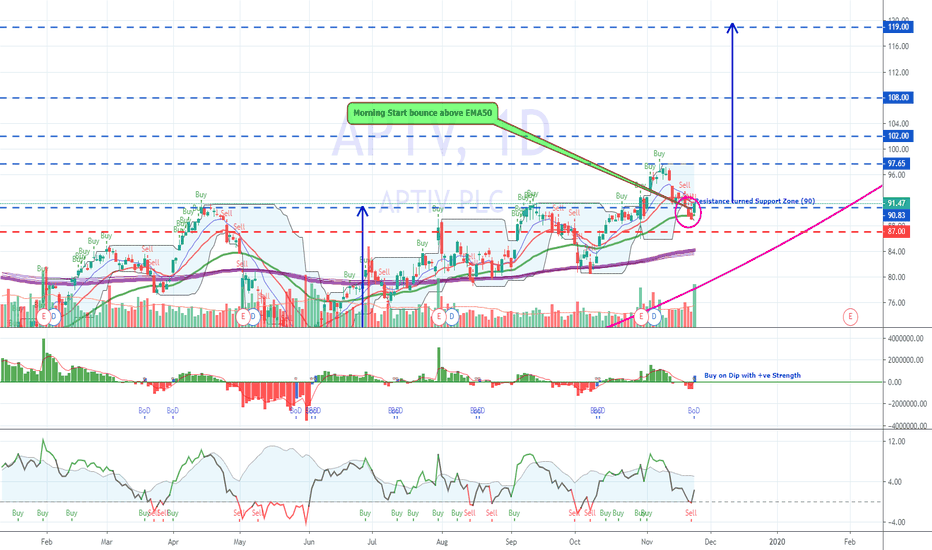
Recently Wolfe Research upgraded APTV from Peer Perform to Outperform Technical Analysis:- +Completed small rounding bottom and moving to complete bigger rounding bottom +Higher High and Higher Low still intact - Uptrend +EMA20>EM50 - Uptrend ++Morning Star (Bullish Patter) bounce above EMA50 & Fibo retracement 0.50 with significant volume - Strong bounce and...
Price staying above EMA20, EMA50 and EMA200 Volume improved with +ve Force Ranging between 0.70 - 0.775 Trade Plan :- 1) Buy On Breakout if Price move above 0.775 with STRONG VOLUME (Volume > 14 days average) 2) Buy on DIP if price bounce above 0.7 with +ve Force (FiFT) with BoD signal.


