kiki_crypto
The pair has been in correction after breaking out ofdaily resistance. The pair was bearish on 1 HR time fram indicating it was under correction. But now the pair have broken it downward trendline and look like its ready to move up. Entry canbe taken once the it break its 1HR TF high with SL below the last low. First TP is et on last daily high.
After a big fall the pair has made some signs of bullishness. RSI Divergence on 1H TF Double Bottom chart pattern.
CHF JPY tried to move but failed to form anybullish momentum. On 4H TF the pair is showing sign of bearishness forming falling wedge with RSI bearish divergence The wesgde has alsobeen broken indicating bearishness to come Entry can be placed as sell stop once the last HL is broken
This pair has recently made good bullish breakout from its previous trend. After bearish divergence formation the pair retraced and is in consolidation phase to dilute the divergence. Entry can be taken at break of consolidation box SL below the box.
The pair was in down trend on 1H TF. In preious session price broke through and formed a HL and HH. To on safe side entry can be taken once the previous high is takn out and SL will the last LL.
The after a good bullish run the GBPAUD seems to slow down and change its trend to bearish one. Bearish Points: -RSI Bearish Divergence -Double Top Formation
this commodity is in down trend for some time. Currently it have broken it trndline on 4H TF. Bullish Divergence along with double bottom chart pattern.
RSI bullish Digergnece formed after a down trend Indicate a reversal is in play which is in same direction as the longer TF trend Entry at emntioned Price
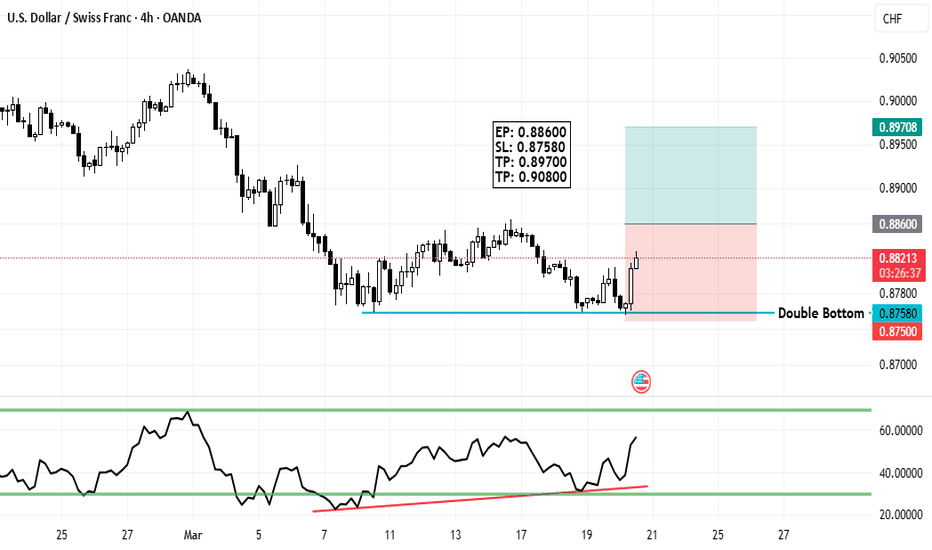
Reversal trade can be taken at usdchf RSI Divergence + Double Bottom.
after breaking its downtrend. RSI divergerence formed and broke the trenline. Than it made a HL than a HH idcating the pair is bullish no 4H TF. Currently the pair is retracing and giving an opprtunity to go long.
USDCHF is in bearish trend making LH & LL on 4H TF. Price has retraced to 0.5 level of and the trend could continue. Entry can be taken at CMP.
The pair formed its firsy HH and HL and now it has come to make andother low. Entry can be taken at retracement level.
pair had shown sign of bullishness on 4H TF. RSI divergence accompanies by fallige wedge chart pattern can be potential buy setup for the pair.
The pair has shown sign of bearihsness on 1H TF. It formed bearish divergence on RSI and falling wedge chart pattern . A short position can be taken after the wedge is brojen by price and the last los is taken out.
THe pir is bearish on 1H TF, there is bearish divergence on RSI as well as double top formation. entry can be taken at break of base woth SL above the last high
The pair is in downtrend and recently contacted with downward trend line and showed bearishness. A big marubozu also further confirm tho downside
The pair has formed double bottom accomapnied by bullish divergencce, entry can be taken once the trendline is broken
On 1H TF the pair had broken its downward trendline and formed a new high. The price has retraced to fib level of 0.5-0.618. Entry can be taken at CMP with SL below the last low.


