Oil had a breakout and is now targeting 58$ and 68$ with support at 52$ Retest support at 52$ is possible and should be a nice entry in this case with tight stop loss.
interesting things happen with zcash chart here
Follow up idea to find targets for related idea (Trade entry: breakout of red trendline): My view of the current price action is that we are in wave 3 of wave 5 of the uptrend. Usually wave 5 extends wave 3 but in some cases its truncated and the rally ends earlier. So the very bullish case here is a new all time high near 0.04 with a cup and handle...
I am not a fan of etc but if the chart says buy if inv h+s pattern breakout neckline near 0.00153 also keep an eye on rsi and momentum as well
To find the bottom for xmr its best to switch back to higher timeframes. 3day has been working best for me but weekly is also fine. As correction of the impulse wave there is a possible parallel channel down (from 3day chart). 1.618 Level was the first support which was broken and ended in another sell-off. Current support was found at the old all time high...
yes... no sh*t sherlock, its very obvious that these prices arent sustainable. Zcash current available supply is 767 ZEC! The supply will reach 100k during the slow mining phase before the full block reward will lead to a 7200zec supply increase per day. At 20$ this would add 144.000$ value per day, so patience is the key, the 5-20$ range or below is where I...
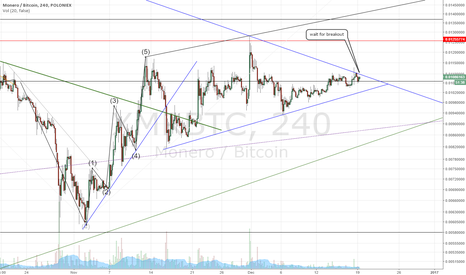
xmr breakout was denied tonight but can still happen :-) long in this case
Follow up idea, see related idea After 5 wave impulse down and two month accumulation phase below IPO level sideways, expect trend reversal into bull market, the downtrend channel got broken and tested on weekly timeframe. The first human got crispered in china. USA will follow in 2017, I speculate on public awareness and solid growth, maybe hype. In case of...
Longed the breakout for little rebound on double bullish divergence on daily and weekly rsi
Follow up idea, see related ideas. after the breakout from blue triangle, the 5400 local top could be projected as parallel channel (blue) from the local lows of the triangle. So expect support at - 5140 (red) resistance to support - 5000 double bottom - 4900 lower channel line expect resistance at - 5300 (purple trendline) - 5400 double top
I see two options: head and shoulders top and retest the breakout (blue) to extend the triangle or consolidation and next leg up to ~ 5150 horizontal resistance (breakout up orange)
btc is in correction again. I see two options: Triangle or ABC. if the blue support line breaks expect wick down which could be a nice entry for longs! If its triangle, can wait for break out. My view on btc is fundamentally bullish, so good to buy on major dips.
NEMBTC had a major correction after massive gains and is now trading in an interesting price range again. I keep buying on dips and hold long term.
Long factom again on this breakout target 0.0048+ It looks similar as the recent btc breakout.
buying NTLA as long term investment in crispr/cas9 technology.
Keep holding btc after break out, see related idea. Some supply should be in the 625-650 area, its were a bunch of early longs will break even. Anyway i think a lot of them already sold with the news of finex hack which caused panic. After that 680-710 is possible. Hashrated is rising as expected, mcaffee's mine has successfully launched.
I enter long as long term investment in CRISPR/Cas9 technology. There is still a patent battle going on, thats why there is the big dump in the chart. Buying here feels like catching the knife, so buying slowly over time.


