kotarosignals
Divergences all across multiple indicators. Bullish bat as well. Will it happen?
LTCBTC will have a bit of a recovery throughout December. The past two months have had the bears ruling the coin however their momentum is decreasing as shown by the divergence. Trade duration: 1 Month Trade start: 8100 Trade target: 8700 Trade confidence: 7/10
Short term bullish divergence however the stoch rsi is oversold. I can see LUNBTC fall a bit more and create a double bottom in the worst case scenario.
Ugh, I hate doing Bitcoin BTCUSD charts because it either makes you a genius or a dumbass on here. However, I feel BTC will have a minor pull back this week back to $4350 or $4600 or even more. I'm not saying it's the start of a new bull run or this week was the lowest it will get. What I am saying is that, there are a few divergences that should not be ignored....
With the news that ARK is release v2, there was a 15% pump and a small correction. It is currently sitting at 0.0001000. This is one of its resistance lines. Can it become the new support line? Divergences? All 3 indicators are showing different results. It seems that a parabolic curve is possible. The big question is, is this the bottom and also how long before...
Trend reversal bullish divergence along with good oscillators. Macd histogram showing green, cci and rsi are both entering buy signals. Happy trading.
Stellar Lumens / XLMBTC has a bearish divergence showing and we can see that it might fall a little bit in the short run. However, we have 3 supports and a trendline support that we can see that might hold the little up streak. From current to Support Line 3 is about a 20% drop, which in my opinion is not likely (but who knows). For me, the most likely scenario...
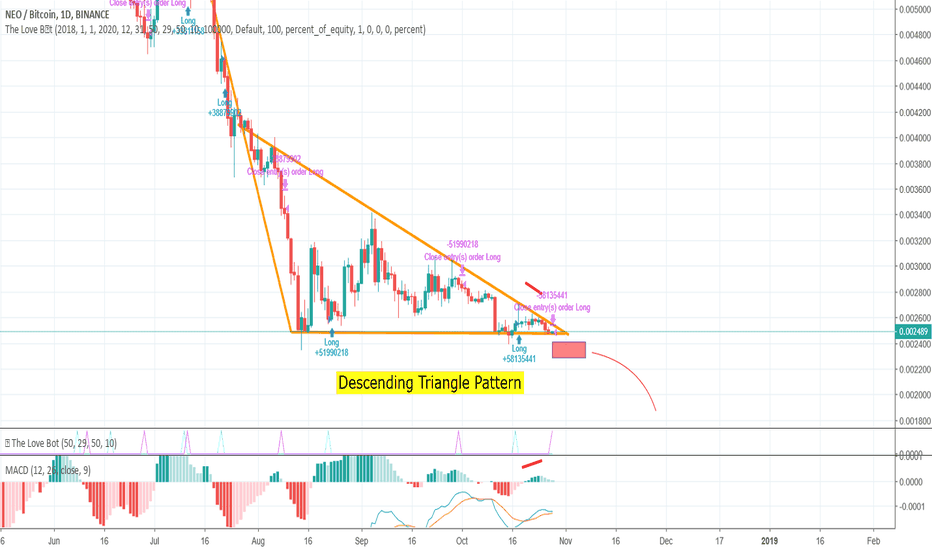
The descending triangle pattern is pretty clear for NEO. Not only that, we see a tiny MACD divergence against the price. All points (including my bot) tells me to short this. If price breaks the support (into the red box), look for the the downhill trend to continue.
QuarkChain had a nice bullish run from August to mid October. Now it is time to have a correction. It is currently residing and testing the support line at 755 Sats. If this breaks, expect it to go down to 645 Sats and test the support line there.
There is a divergence from closing prices on XRPUSD (RIPPLE) on all 3 major indicators I use. It's a hidden bear divergence that will continue the pattern. There is a good support that's been tested multiple times so it will be wise to see if they hold up or not.
$TSQ or Townsquare Media is looking to go long with the formation of a double bottom pattern. CCI has entered into -100 channel, signaling a buy. It seems that for the first time, the company is providing net positive income. Expect this 2,000+ employee company to do well this Q4. Target Price: $9.75 Target Price 2: $13.40
Small trade as it showing a hidden bull. My guess is that it'll play the current trendlines. From 0.000500 to 0.000540. (about 7.5%) My stop-loss would be set around 0.000480 - 0.000490. A positive side is that if on the way up, it breaks the trend, we can have a breakout for further gains.
NFLX had an incredible bullish run that seems like its coming to an end. Prepare for a bear run until Q1 2019 earnings call. You can see the formation of the right shoulder. If the pattern holds and my guesses are correct, these are the stops to use. Stop #1: $308 Stop #2: $286 Stop #3: $201
To continue from my previous post, CRNT has a major hidden bull RSI Divergence right before their earnings call. Coupled that with the long signal from weeks before from my script, it looks very promising. Also, keep an eye out on my Fib resistance lines. CRNT has a nice pattern of playing on those lines. Lets hope for big gains on Monday and Tuesday. (Sorry...
Etherparty ticker FUELBTC will continue its uptrend as we clearly see a Hidden Bullish Divergence in the RSI and price action. Even with the uncertainty with Bitcoin and Bitcoin Cash and how it will effect alts, FUEL seems to be a safe bet to see an additional 10-20%+ increase this week. I expect a closing of 500 sats within a few days.
For the immediate future, BTC looks like it will drop to around $6,110 as part of a consolidation til around the first two weeks of November. We will revisit the charts after the consolidation but my overall sentiment is bullish. MACD indicator is slowly creeping to the 0 line... a positive sign that has been absent for all of 2018. Last week of October - end...
Currently on the first support line and with its entire 2018 gain erased, it seems like the market will see a significant drop til mid November where it will see its second support line. If it leads to the second support line, it will be a 3000 point drop since the high on October 3rd. In the media, you will definitely hear the FUD. "Start of another recession"...
A little known stock called Ceragon Networks will play a role in the rollout of 5G networks in the United States. With the earnings call coming in less than a week, I see this bullish stock to test the resistance around $4.07. I have this in my mid term portfolio til 5G rolls out.


