lilothebest
Going into 2021, we have seen a parabolic rally with unstoppable momentum, from 4k all the way to 64k , without any noticeable, if any, price reduction or stops along the way. if history has proven something, it is that for every action there is a reaction. As shown on the chart the parabolic advance curve is broken "plus a retest/rejection to boot". In the last...
Blue buy zone targets in white Stop is parabolic trend bypassed
So i noticed MTL has lots of volume going on KRW pair, decided to hit the chart there although i dont know any korean Noticed that the chart is at a local key support, which is not visible on binance Trade Setup : Buy when local high is broken @ 4800 along with the long term trend being broken Short term target and mid term target as shown on chart Short term...
990% Increase calculated from area where price touch the 18 MA it is just a pattern i saw nothing concrete Will history repeat itself?
Best Long/Short time is before the 26/8 august time stamp
Targets are the orange resistance ( in case not obvious ) Price&Energy doesn't like to be restricted Money-Management is advised, trade is considered active after Trend line is broken Brief Fundamentals : Fake-ETH, nothing new here Listed on coinbase Accumulation for over a year
ELF has a nice trade setup on the Daily Timeframe Broke the downtrend, SRSI seems topped but it was also topped the last time it bull-run Conditions are exactly the same Althou i dont expect it to form new ATH as the RSI is already past midpoint. Long ELF till Green Area between The Fibs Stop-loss < 9700 Sats R/R ratio is between 5.7 and 7 Good Risk...
Buy Zone is the Green Box area Second buy zone is the breaking of the teal downward trend line Short-term Target : Red Lines Long-term Target : Yellow line Stop-loss < White Line Re-buy zone if stop hits : purple Line Volume suddenly declined to 10% of normal daily volume bars, this indicates that whales want to keep the price at the current level for a...
Everything You need to know is on chart ,Just click Run button if you want to know where we are/price is. Good Risk managements is Adviced If you have any Questions dont hesitate to ask in the comments
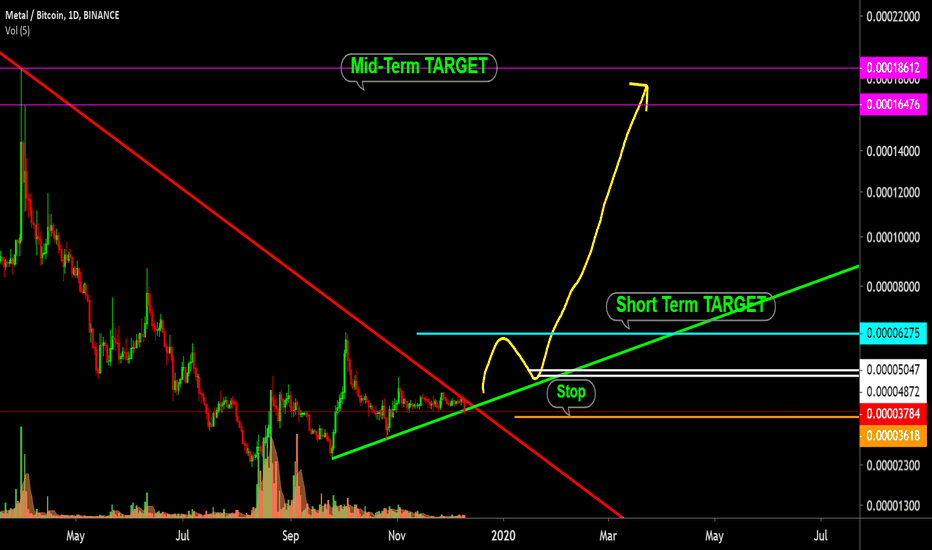
Targets on chart ,Sell @ pink resistance All the targets are void till breaking of 71k Good Risk Management is advised Brief Fundamentals : MTL is an Ethereum Token that uses MetalPay's unique Proof-of-Processed Payments (PoPP) to identify and reward users by giving them back up to 5% of their transactions in the form of MTL. No ICO ,only Pre-sale Easy to use...
Details on Chart . Risk/Reward is 5.5 for Target 3 . Ardr retraced 98% of the previous bullrun and lost 85% of its price ,after such a sharp drop comes a massive price rise.Even a shit/scam coin without fundamentals will pump when met with such conditions Tp1 is the recommended target ,Wait for two daily candles close above The red area before aiming for the...
Stratis is looking extremely good on the weekly chart ,Historical support held and the volume declined on the down-move with a successful test . Stoch just had a crossover MACD histogram about to turn positive Breaking of the 60 lvl on the RSI will signal a fomo bullish move Risk/Reward is 6 for Target 1 All of these are positive signs for med-term hodl ( 1~3...
As you can see in buttcash chart ,Inverted Head&Shoulders is currently forming Buy Area : $600~685 Stop-loss < $550 ,Upon Breaking of Neckline ,change stop to slightly below the line TP are the Red resistance lines ,give or take a couple of bucks 1st : 755~760 ( H&S target ) 2nd : 845~852 3rd : 945~958 4th : 1050~1120 ( Fib 0.23 ) Final : 1550~1625 ( Fib...
Buy 50~55k stop loss < 49.5k Sell zones are the red lines ,higher target = longer wait TP1 : 65~68.8K TP2 : 75~76.3K TP3 @golden line 83.6k TP4 : 94.5~95k TP5 : 100k~Previous ATH @115k Golden line is a Critical line .breaking of that will signal a move to the next targets This is a 3 month pattern ,that long of a duration indicates a Strong&Fast move Risk...
As you can see in this idea ,DGB is holding nicely over the trend and Green support area. Daily volume has declined implying selling has stopped. The whole green area between the lines are Buy zones Buy strategy : slow-accumulation ,buy small amounts every time it dips ,buy the rest when it breaks the teal trend-line Their is 3 Take profit areas marked on the...
Fundamentals : Check Buy zone : Check Short-term and long term Profit : Check News Coming : Check Sweet R/R : Check What more do you need to be convinced ? Short-term Target : 6k Sats Long-term targets : Previous ATH @9k Then 11.5k Sats as a new ATH Stop-loss < 2400 Good Risk management is advised ,Give the Trade time to develop and don't be hasty


