linofx1
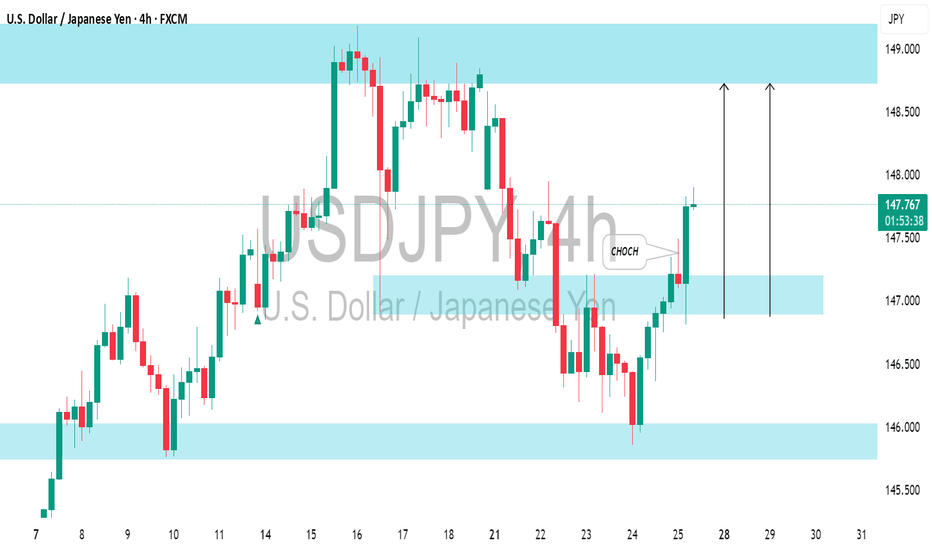
PremiumI spotted a confirmed Change of Character on 📈USDJPY on 4-hour timeframe. The market, currently in a global bullish trend, has effectively broken through a minor bearish trend and surpassed a key horizontal resistance level. It is likely to continue rising, with the next resistance at 149.00.
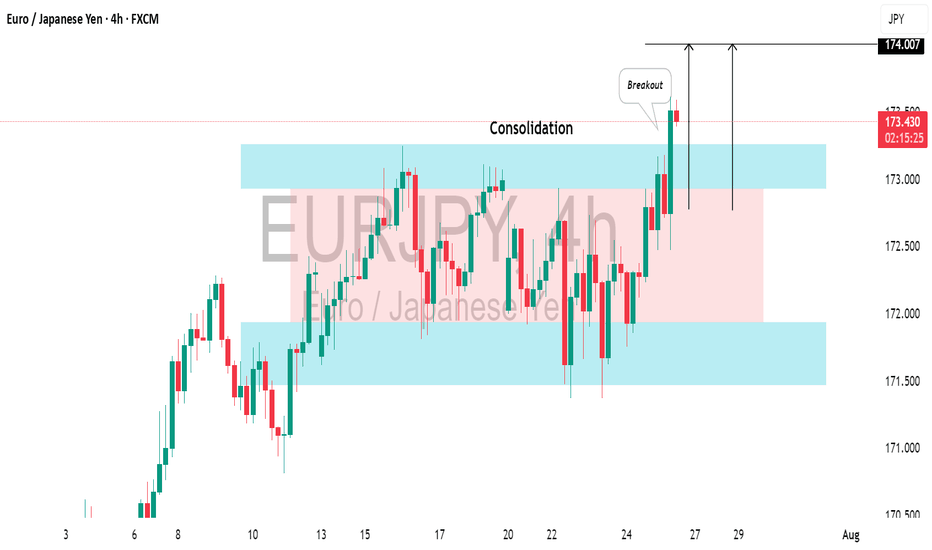
It seems like 📈EURJPY has finished consolidating within a broad horizontal channel on the 4H chart. The formation of a new higher high today suggests potential upward movement. Since it's Friday, I recommend considering trend-following buys starting Monday. We should wait for the market to close above the highlighted resistance to establish a Higher Close on...
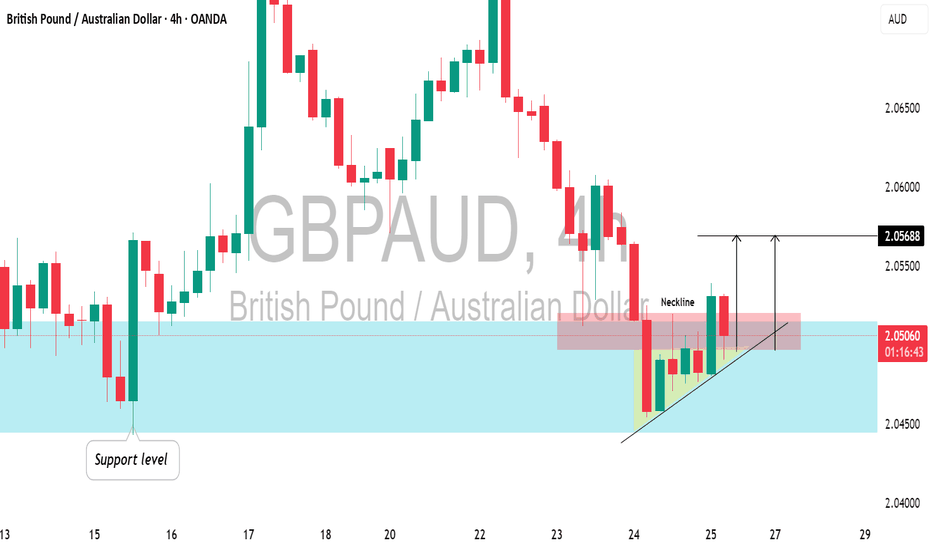
GBPAUD formed an ascending triangle pattern at a significant daily/intraday horizontal support. And breaking its neckline indicates buyer strength. I anticipate the pair could rise to the 2.0568 level.
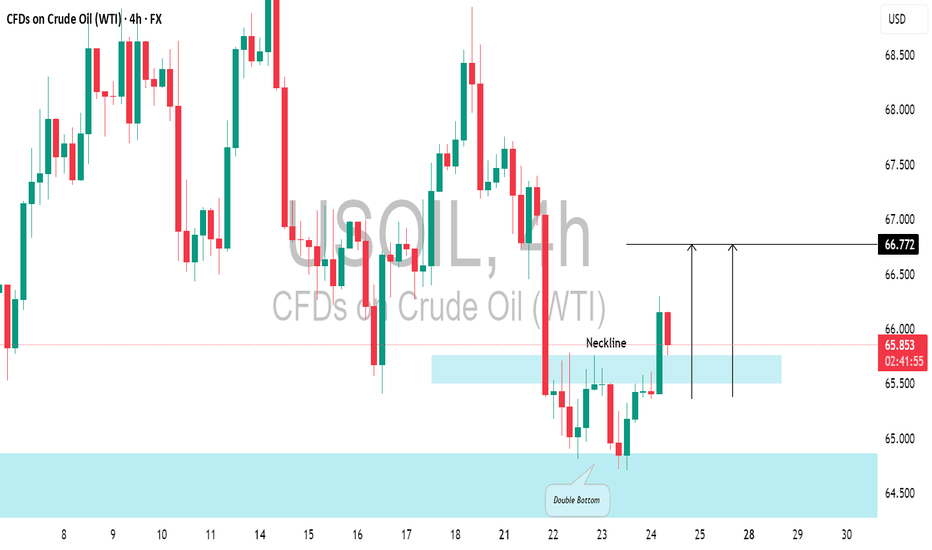
📈USOIL responded well to the highlighted daily support level. The price formed a double bottom pattern on that and broke above its neckline. There's a strong likelihood that the price will continue to increase and reach 66.72 shortly.
GOLD could retreat from the highlighted resistance level. I observed a horizontal trading range pattern following a test of significant intraday resistance, along with a breach of its support level marked by a strong bearish candle. Target - 3400.
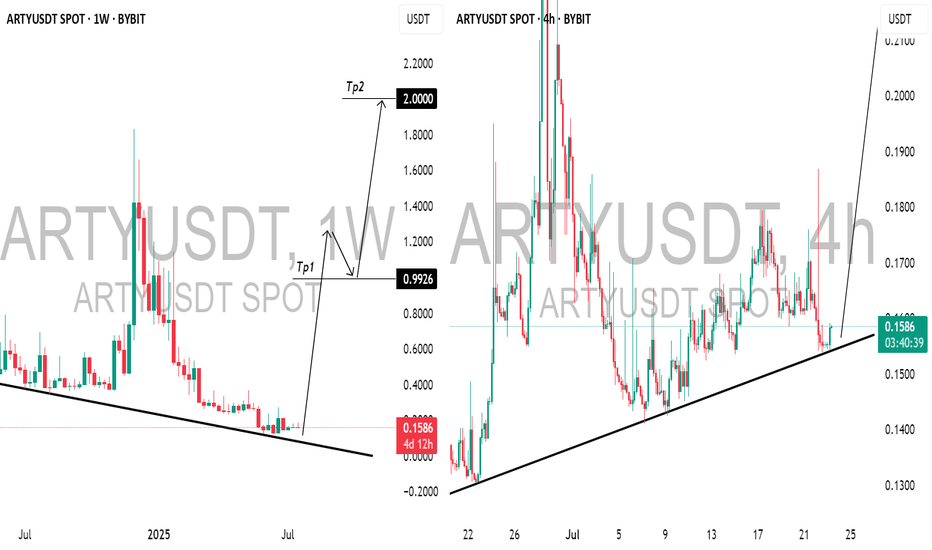
This morning, while analyzing 📈ARTY on a weekly chart, I noticed a promising bullish signal following a test of a falling trend line. The price has been adhering well to a rising trend line on the 4-hour chart, and after a recent test, we observed a positive bullish reaction, prompting me to enter a long position. Recently, early investors took profits from...
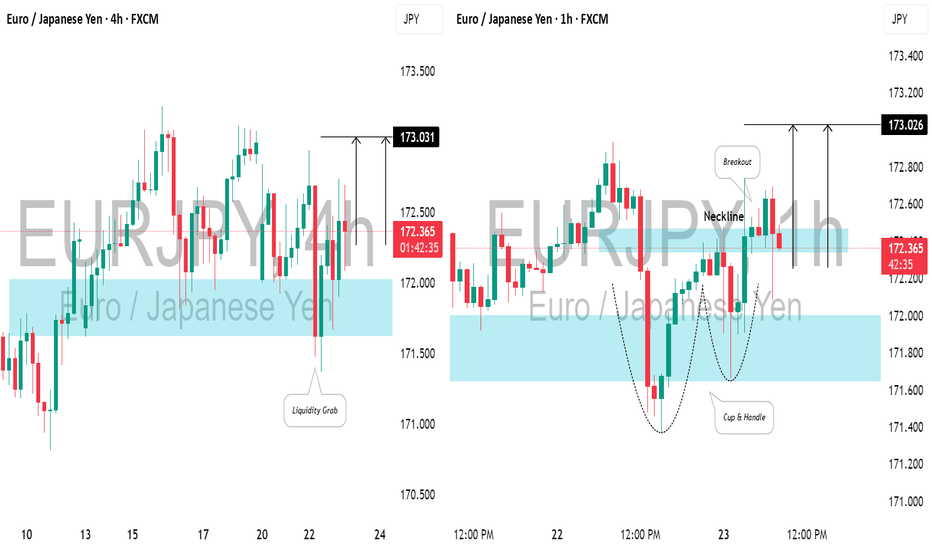
📈EURJPY created a bearish high-range candle beneath a crucial support level in a horizontal trading range on the 4-hour chart. However, a subsequent recovery and a bullish opening in the Asian session indicate a strong likelihood of an upward movement today, targeting 173.00.
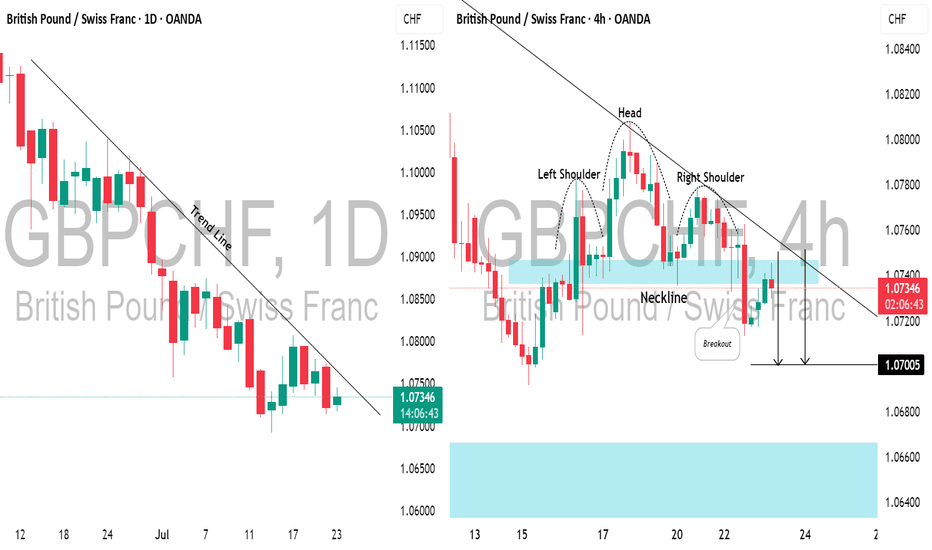
I spotted a strong descending trend line on 📉GBPCHF, with the price rising to that last week on a daily. As it tested this level, the pair formed an inverted head and shoulders pattern on a 4-hour time frame. The neckline has recently been broken and retested. I anticipate a bearish move towards the 1.0700 level now.
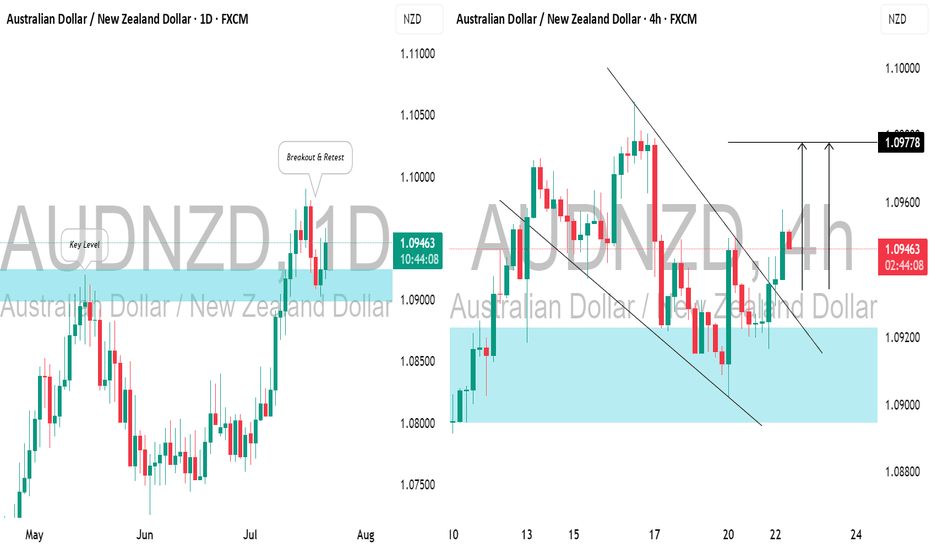
📈AUDNZD has surpassed and closed above a key horizontal daily resistance level. After retesting this broken structure, the price rebounded and broke above a resistance line of a falling wedge pattern, suggesting a strong likelihood of a bullish trend resumption. The price is expected to reach the 1.0977 level soon.
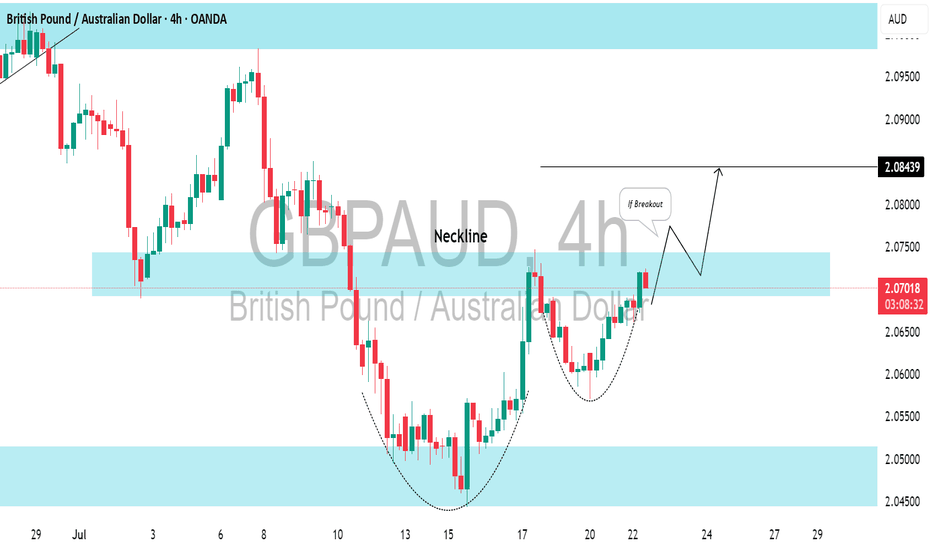
⚠️GBPAUD has adhered to a horizontal support level on the intraday chart and has bounced back from it, revealing a strong bullish pattern. The price has formed a cup and handle pattern and is currently testing its neckline. Look for a breakout confirmation; a 4-hour candle closing above the 2.0750 level will validate this breakout, leading to an anticipated...
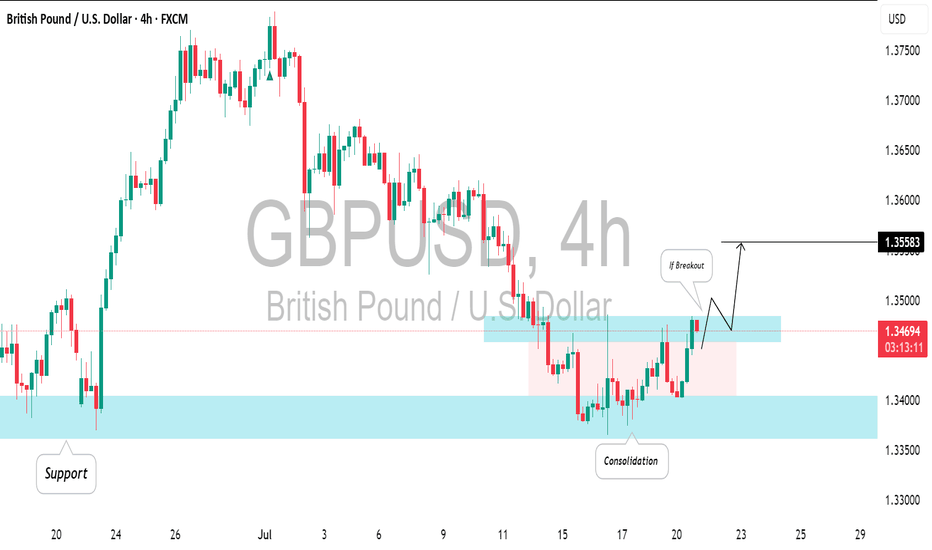
The GBPUSD is currently consolidating at a solid intraday/daily support level. To enter a buy position with confirmation, it's advisable to wait for a breakout on the 4-hour chart. A breakout followed by a 4-hour candle closing above the horizontal resistance will serve as a strong bullish signal, with a target of 1.3558. Conversely, if the price makes a new...
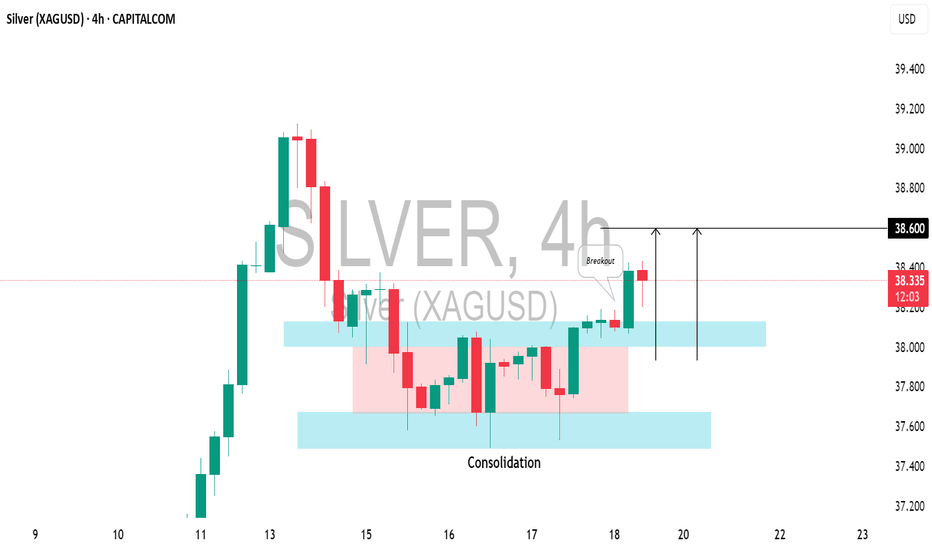
It appears that the local correction on 📈SILVER has completed, and the pair is shifting back to a bullish trend. Today's US economic data caused the pair to break through a resistance level within a narrow consolidation range on the 4-hour chart. The price is expected to rise to the 38.60 level.
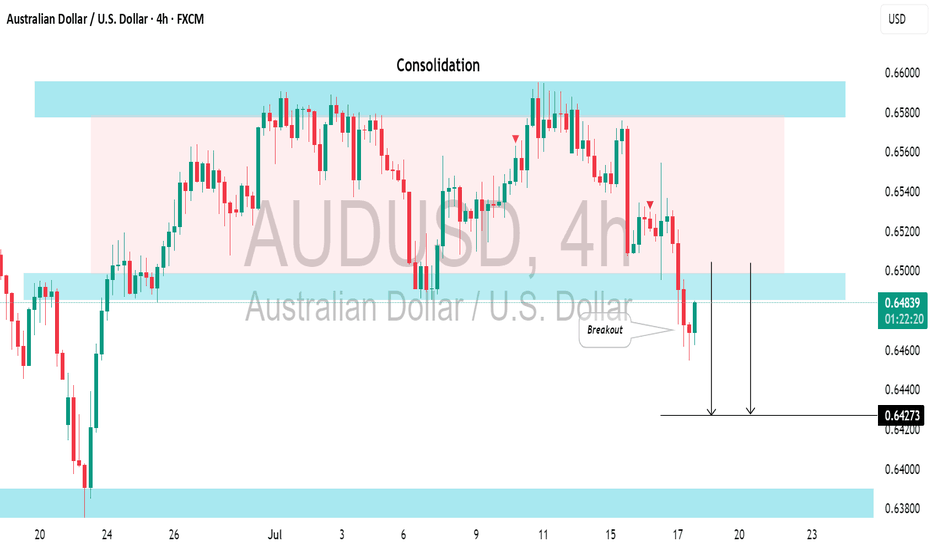
The AUDUSD appears to be bearish following a few weeks of consolidation. And a bearish breakout from the support of a sideways range serves as a strong confirmation signal. We can anticipate a decline to at least the 0.6427 level.
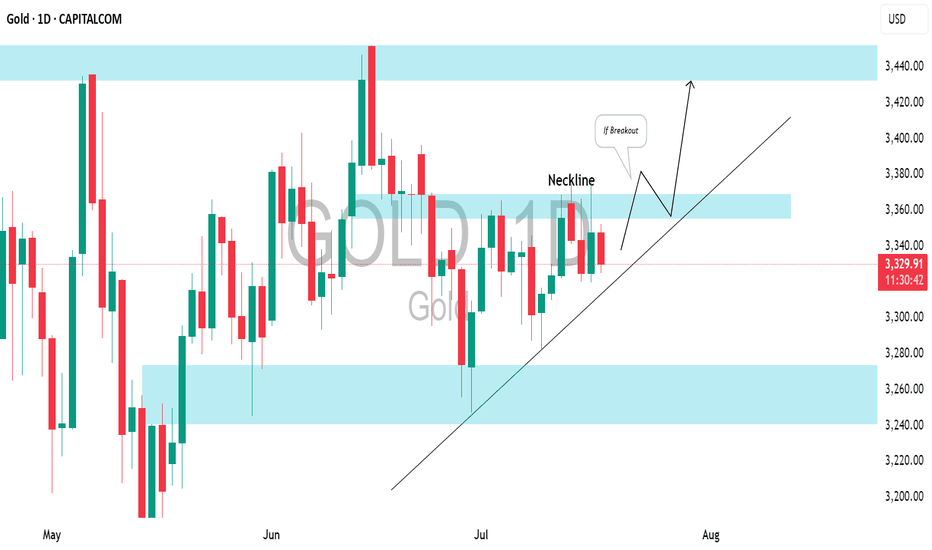
I spotted a clear ascending triangle pattern on a daily time frame. To validate a bullish continuation, we need a breakout above the neckline. A daily candle close above 3370 will serve as a strong confirmation, and we can expect a move up to at least the 3440 resistance level.
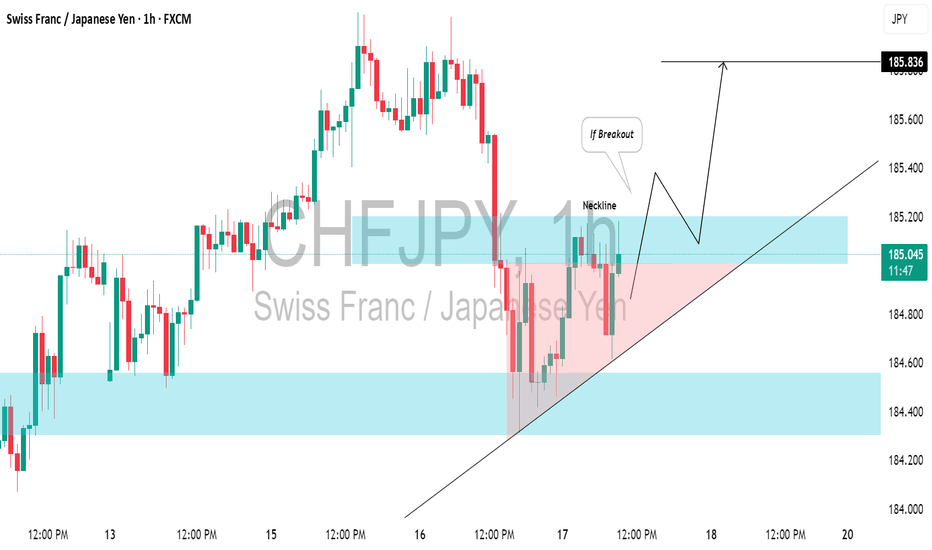
⚠️CHFJPY is currently testing a recently breached key daily/intraday resistance level, which is likely to have become support. We will look for a confirmation to buy when there is a bullish breakout above the neckline of an ascending triangle pattern on the 1-hour chart. A close above 185.20 will validate this breakout, and we anticipate a bullish continuation...
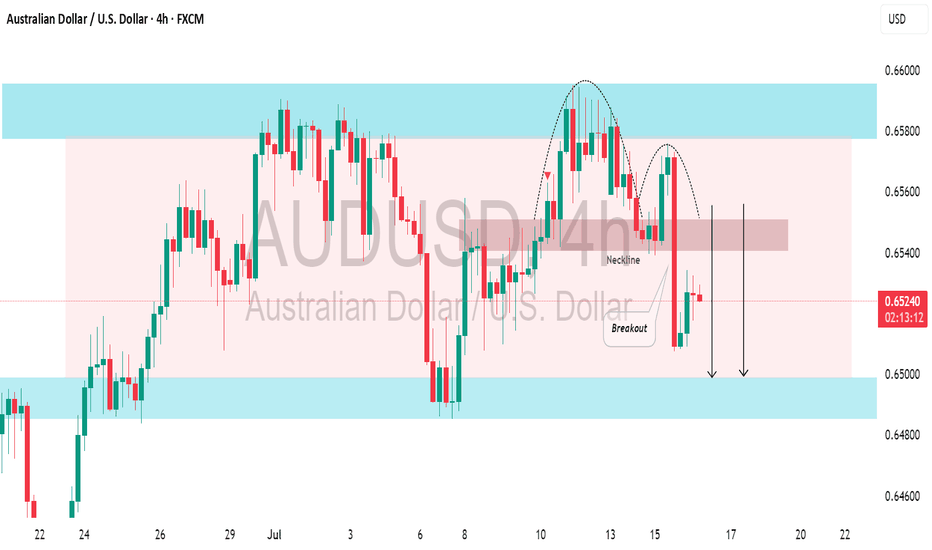
The AUDUSD is currently consolidating within a broad horizontal channel. A notable bearish response to resistance has occurred, with the formation of a cup and handle pattern leading to a decline. There is a strong likelihood that the price will soon hit the 0.6500 level.
📈 USDJPY is set to increase further in price after breaking through a significant daily/intraday horizontal resistance. The next target is 147.81.
EURUSD is expected to maintain a bearish trend following a confirmed breakout below a significant horizontal support level. The broken structure, along with a descending trend line, creates a contracting supply zone, indicating a strong likelihood of further downward movement. The next target is 1.1620 support
