It is likely that the 📉AUDUSD will drop lower in the near future. The formation of a head and shoulders pattern, along with a breakout of its neckline after testing a key resistance, indicates a strong bearish signal. The target is set at 0.6218.
Gold is currently experiencing a strong bullish trend and has recently reached a new all-time high. The market is now consolidating within a horizontal range on an hourly timeframe. If the support of this range is broken, it could signal a significant bearish reversal, potentially leading to a drop in prices to the 3090 level.
The GBPAUD is currently in a strong bullish trend on a daily basis. Over the past three weeks, the pair has been trading within a horizontal range. As the market opens after the weekend, the pair is showing strong bullish momentum. Breaking above the resistance line of the range suggests that a bullish accumulation has been completed. This breach of resistance...
SILVER was accumulating within a tight trading range on a 4H time frame for nearly two days. The release of recent fundamental news caused a significant uptrend, breaking through the range resistance and a key daily resistance level with a high momentum bullish candle. The previously broken levels are now acting as support. I believe that the bullish momentum...
Gold reached a new all-time high, breaking through a key daily/intraday resistance level based on previous all time high. This broken resistance level is now acting as a strong support. It is expected that the price will continue to rise and reach 3100 in the near future.
I see another bullish pattern on 📈CHFJPY, this time in the form of an ascending triangle formation. The price has broken above the neckline and closed higher, indicating a strong uptrend. This pattern suggests that there is a high likelihood of continued growth, with the next resistance level at 172.
EURAUD formed a huge cup and handle pattern and has broken through its neckline on a 4-hour time frame. This breakout confirms a change in market sentiment and suggests a potential bearish reversal in the near term. It is possible that the market will continue to decline and could soon reach the 1.7000 level.
The GBPCAD pair is showing a clear bearish trend on the 4-hour chart following a confirmed break below a significant intraday support level. This suggests a possible continuation of the downtrend towards the 1.8420 level. Prepare for more downward movement.
Gold is currently experiencing a strong upward trend in trading. Following a recent all-time high, the market started a correctional movement. The price respected the strong support level at the 3000 psychological level, leading to a bullish wave that broke above a neckline of a cup and handle pattern acting as a local horizontal resistance. This is expected to...
Another pair that appears attractive for buying at a key support level is 📈CHFJPY. Following a test of an important intraday structure, the price has formed a cup & handle pattern. A bullish breakout above its neckline serves as a solid bullish confirmation. It is likely that the pair will continue to climb and reach the 170.24 level in the near future.
Bitcoin has formed an ascending triangle pattern on a 4-hour chart. The neckline has been broken, followed by a positive bullish reaction after a deep retest of the pattern. This indicates a strong signal for a bullish reversal, with a potential move towards 90,000.
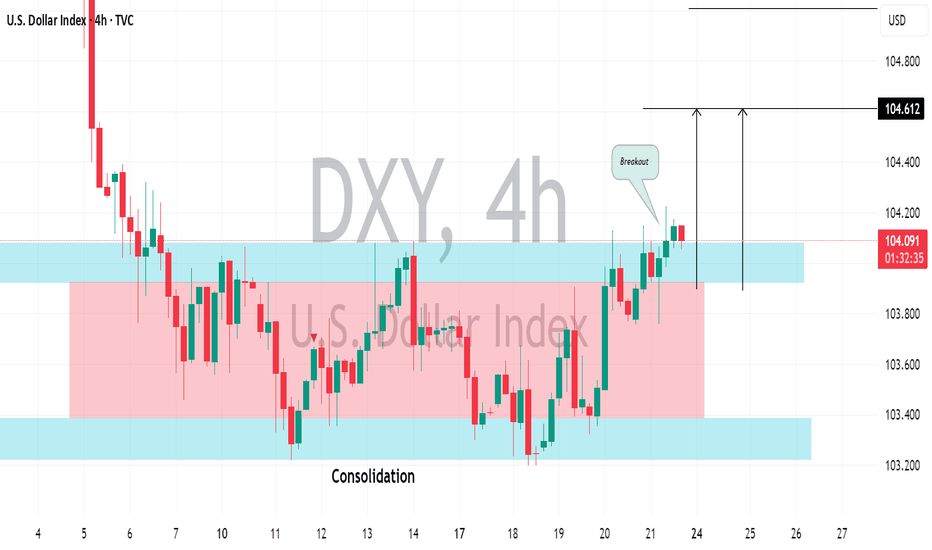
The Dollar Index appears to be showing bullish signs following a period of consolidation lasting two weeks. A breakout above a resistance level in a sideways trading range is a strong signal of confirmation. It is likely that we will see a move upwards, potentially reaching the 104.10 level.
The GBPAUD pair appears to be showing a bearish trend on the 4-hour time frame after testing a significant intraday resistance. An inverted cup & handle pattern was formed on the hourly chart, along with strong bearish momentum this morning, indicating a potential downward movement. I believe that the market may retrace back to the 2.0500 support level at the...
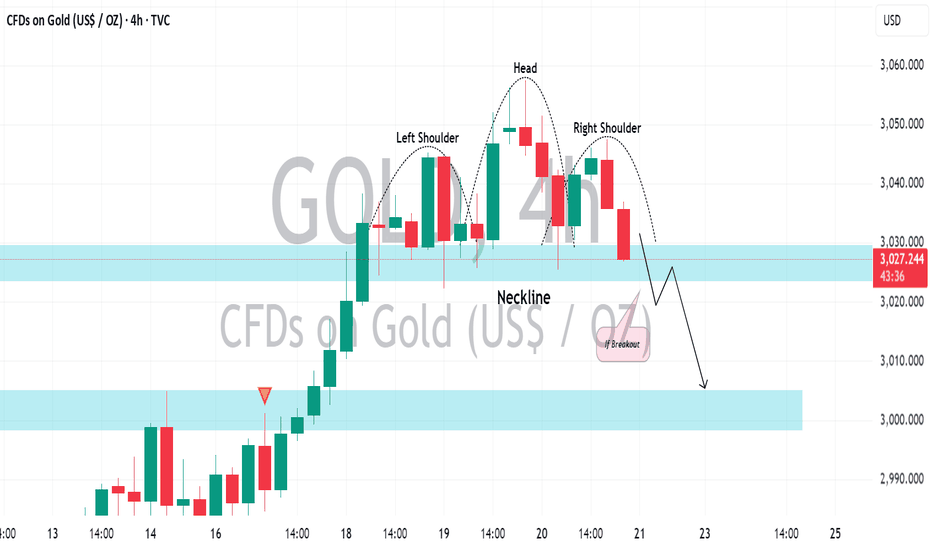
After experiencing a strong uptrend, ⚠️Gold appears to be overbought. By analyzing the 4H chart, we can see a complete head and shoulders pattern. A bearish trend will be confirmed if the price breaks below the horizontal neckline. If a 4-hour candle closes below 3022, we can anticipate a significant pullback to around 3000.
Silver formed a classic head and shoulders pattern on the 4-hour chart. Following the release of US fundamentals today, the price quickly dropped significant and broke below the pattern's neckline. The price currently retesting the broken neckline, suggesting a potential continuation of the bearish reversal. The next support levels to watch for are at 33.05.
Ripple's price saw a positive shift following the SEC officially dropping the lawsuit against XRP. The price broke through a key daily resistance level, indicating a bullish trend reversal. A cup and handle pattern was formed with a broken horizontal neckline, suggesting a confirmed bullish reversal. I anticipate further growth in the market, with potential...
Take a look at the price movement of ⚠️BITCOIN, the market is consolidating around a significant daily support level. Analyzing a 4-hour chart, I spotted a descending trend line and a potential inverted head and shoulders pattern. The left shoulder and head have already formed, and the right shoulder is currently in progress. The neckline for this pattern is...
The 📈GBPCAD pair retested a horizontal structure that was previously broken on the 4-hour chart. Following this retest, the price formed an inverse head and shoulders pattern and broke above a resistance line of a bullish flag pattern. This suggests potential upward movement in the near future. The next resistance level to watch is at 1.8692.


