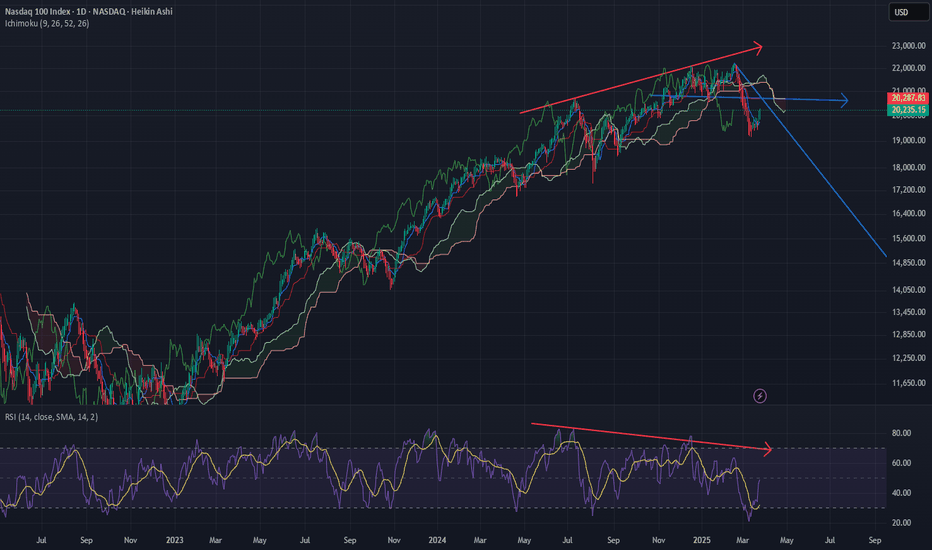
Hey everyone, here’s my quick take on the NASDAQ 100 (NDX) and why I’m keeping an eye on a potential global recession: 1. Bearish Divergence on the Chart We’ve got the price pushing higher while the RSI is sloping lower—classic bearish divergence. It’s a big red flag that momentum isn’t matching price action. Sure, it doesn’t guarantee a drop, but it definitely...
: 🚨 NASDAQ:TSLA - MASSIVE SHORT INCOMING? 🚨 Weekly Bearish Divergence Alert 🔻 Tesla is flashing major warning signs on the weekly chart. While price has pushed higher recently, momentum is doing the opposite — bearish divergence on the RSI/MACD is undeniable. 📉 Price Action: TSLA is struggling to reclaim key resistance near $200–$210. The recent rally looks...
The recent disclosure by Citigroup Global Markets highlights heightened volatility and speculative market actions, suggesting underlying uncertainty in Aviva plc's future prospects. With the company currently embroiled in takeover or merger discussions, short-term traders are actively taking positions both through traditional equities and cash-settled derivatives,...
It costs 2 pennies to make one penny, copper isn't needed for money in the U.S, scrappers are at an all-time high and demand is outweighing need
Other than the MACD and Trump getting in, what about this tells you we aren't dumping to the pits of hell
In the world of finance and investing, keeping a watchful eye on market trends and indicators is essential for making informed decisions. Lately, I've been closely monitoring the 20-year bond market, and I've noticed some intriguing signals that could have far-reaching implications for the financial landscape. What caught my attention is the presence of a...
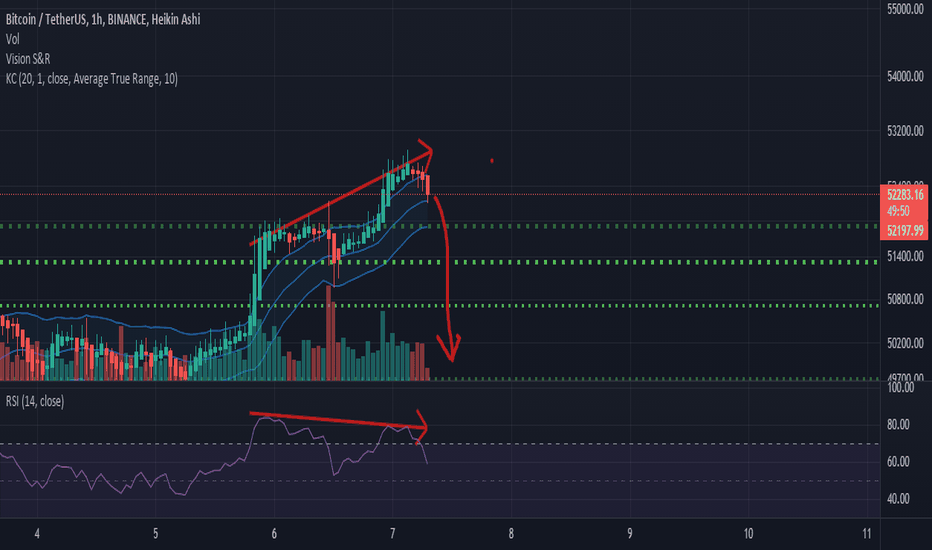
Here is my idea, simply it is very obvious bearish divergence on the rsi. SHORT - Stoploss at $52,840
Check out the obvious head and shoulders on the 1hr RSI, what are your thoughts?
Here we have very obvious bearish divergence, short btc, eth and bch
Check out the 15 min chart, we have a very obvious hidden divergence.
BTC is building a bear flag and this run-up will see heavy resistance and I believe it will fall off a cliff down to possibly 12k
See chart for idea, downward pressure expected
Here is some basic channel charting and I believe we are going up
I see we are in a current pull back, long term it is pretty obvious btc will break 100K and 2022 is the winter we must all prepare for!
just some bad charting that has done me quite well so feel to have a look
As we move with the trend line it is looking clear BTC is in a bear market, as for the short term, mind the pun, shorting BTC to around 30k to 31k to be safe is a great idea, the real story begins when we are floating around that 30k mark, then all bets are off and my suggestion is to wait for the price action and then wait for the pullback after it breaks out of...


